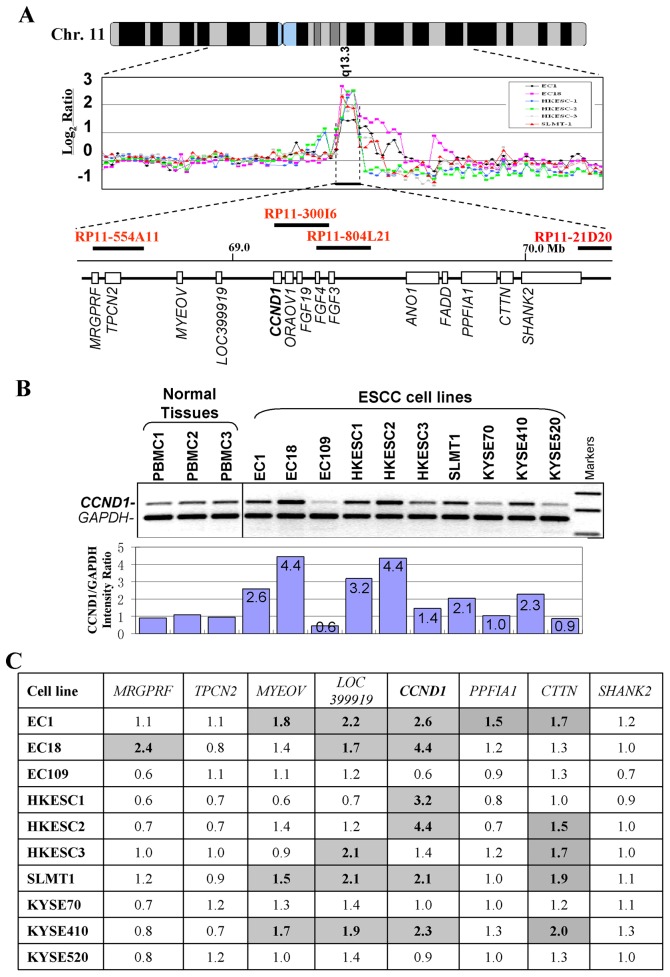
Figure 3. CCND1 is located at the center of the 11q13 amplicon in ESCC. A .
, aCGH profiles of six ESCC cell lines at the CCND1 locus. Normalized log2 signal ratios were plotted. Amplifications were defined as log2 signal intensities ≥1. Horizontal lines denote log2 signal ratios from −1 to 3 with copy number increasing upwards. Each black/colorful dot represents a single BAC clone. Names of related BAC clones are also shown. Transcript map of the core 11q13 amplicon is shown in the bottom. B, Semi-quantitative duplex genomic DNA PCR analysis of CCND1 in 10 ESCC cell lines and 3 normal PBMC samples. Signal intensity ratios of CCND1/GAPDH are shown. C, Summary of gene copy number changes of several genes within the 11q13 amplicon. Numbers shown in the table are folds of copy numbers of ESCC cell lines relative to the mean values of three PBMC samples. PBMC, peripheral blood mononuclear cell.

