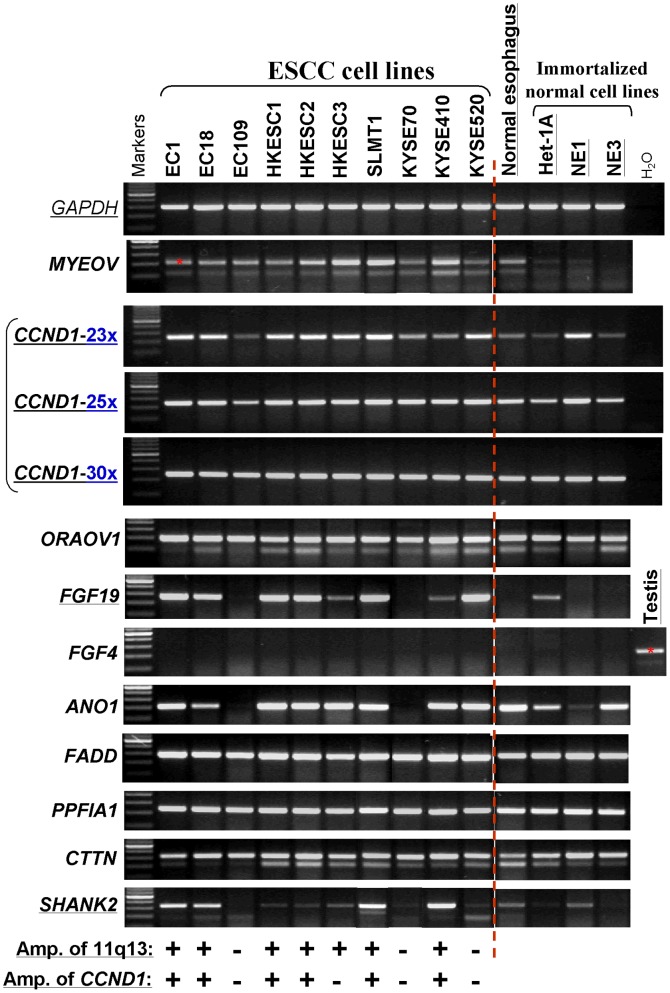
Figure 4. Expression levels of several 11q13 genes around CCND1 in ESCC cell lines examined by semi-quantitative RT-PCR.
The amplification status of 11q13 region by aCGH and CCND1 by multiplex DNA PCR are listed at the bottom. +, amplified; -, not amplified. 23x, 25x, 30x: RT-PCR cycles. All other genes were examined by RT-PCR with 30 cycles, with GAPDH for only 23 cycles.

