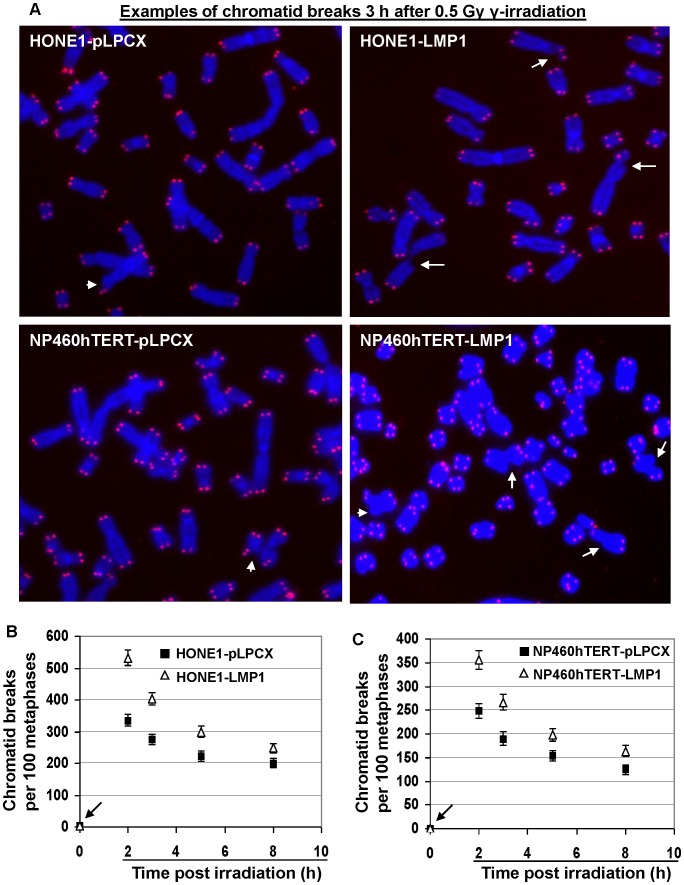
Figure 2. Frequencies of chromatid breaks in LMP1-expressing and control cells.
A, Examples of chromatid breaks 3 h after 0.5 Gy γ-irradiation. The nascent chromatid breaks (as indicated by arrows) were identified by the chromatid gap larger than the width of the chromatid and the lack of telomere signals. The short arrows indicate the subtle terminal chromatid breaks. Telomeres were detected by red signals and DNA was stained blue by DAPI. B and C, Frequencies of chromatid breaks before or after γ-irradiation. Error bars represent standard deviations. For all time points analyzed, the frequencies of chromatid breaks in LMP1-expressing cells were significantly higher (P<0.05) than empty vector-infected cells.

