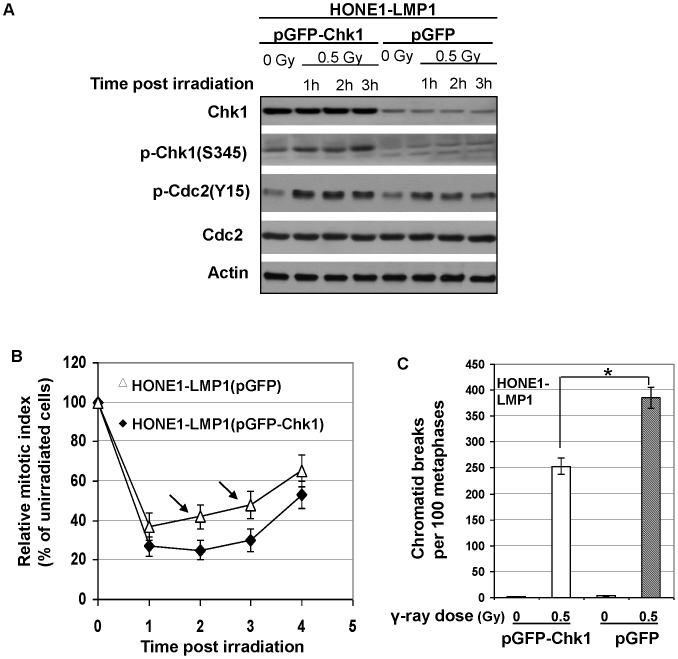
Figure 4. G2 checkpoint improvement in HONE1-LMP1 cells with ectopic Chk1 overexpression.
A, Western Blotting analysis of Chk1, p-Chk1(S345), p-Cdc2(Y15) and Cdc2. Actin shows protein loading controls. B, Relative mitotic index at different time points after γ-ray irradiation. Error bars represent standard deviations. Arrows indicated the relative mitotic indices in HONE1-LMP1 cells transfected with control plasmids (pEGFP) significantly higher (P<0.05) than HONE1-LMP1 cells transfected with Chk1-expressing plasmids (pEGFP-Chk1). C, Frequencies of chromatid breaks before or after γ-irradiation. Error bars represent standard deviations. Stars indicated significant differences (P<0.05) between the indicated datum pairs.

