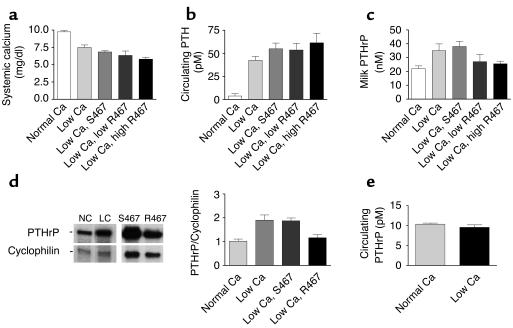
Figure 4.
Plasma calcium, PTH, and PTHrP levels, milk PTHrP concentrations, and PTHrP mRNA expression levels in lactating mice fed a normal calcium diet, a low calcium diet, or a low calcium diet and treated with either NPS S467 or NPS R467. (a) Plasma calcium concentrations in mice fed either a normal-calcium diet (0.6%) or a low-calcium diet (0.01%). Mice on a low-calcium diet either received nothing (low Ca) or were infused with NPS S467 at 40 μmol/kg/d or with NPS R467 at doses of 4 μmol/kg/d (low R467) or 40 μmol/kg/d (high R467). Calcium restriction led to a significant decline in plasma calcium (P < 0.001, normal Ca vs. low Ca). The higher dose of NPS R467 led to a further significant decline in plasma calcium (P < 0.01, low Ca vs. low Ca plus high R467). (b) Plasma PTH in mice on normal or low-calcium diets with or without calcimimetic treatment. (c) Milk PTHrP concentrations in the same groups described above. Milk PTHrP concentrations were significantly different in groups given low Ca (P < 0.05) and low Ca plus S467 (P < 0.05) compared with the group on a normal diet. However, milk PTHrP concentrations in the mice treated with NPS R467 were not significantly different from baseline. (d) PTHrP mRNA levels in mammary glands of mice on a normal-calcium diet (NC), a low-calcium diet (LC), a low-calcium diet with NPS S467 treatment (40 μmol/kg/d), or a low-calcium diet with NPS R467 treatment (40 μmol/kg/d) assessed by RNase protection analysis. Forty micrograms of total RNA was assayed. The bar graph represents cumulative data from four animals per treatment normalized to cyclophilin. (e) Circulating plasma PTHrP levels in mice fed a normal-calcium diet or a low-calcium diet.

