
Figure 3. Quantitative real-time PCR analysis showing predominant expression of 3 novel miRNAs in eggs.
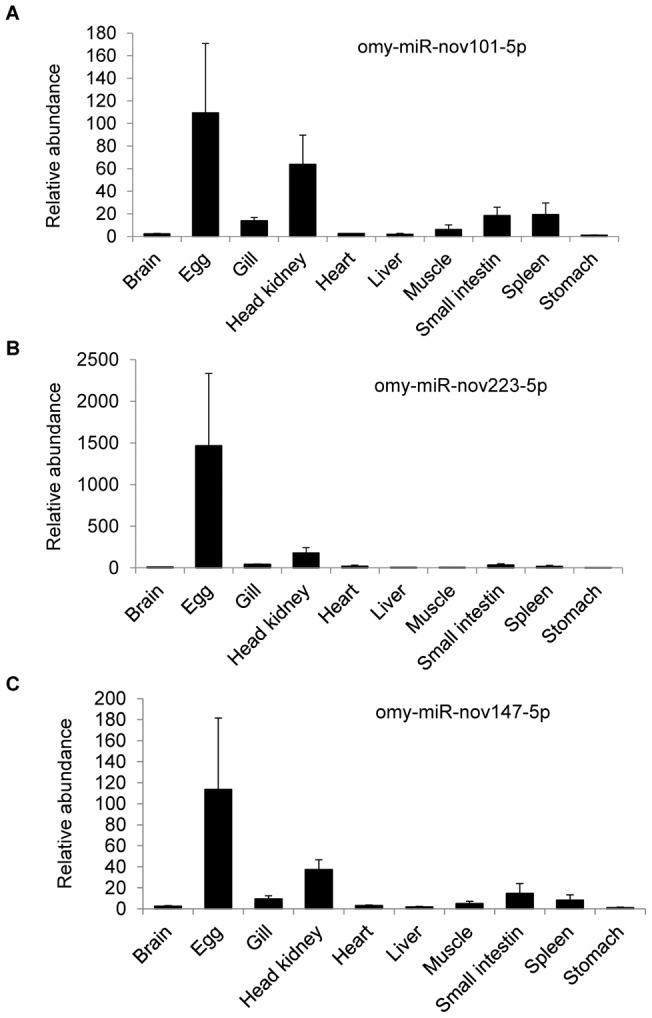
cDNA samples from 10 tissues including gill, liver, stomach, and head kidney, muscle, egg, heart, small intestine, brain and spleen were used in real time PCR analysis to identify novel miRNAs predominantly expressed in eggs. The means of the normalized miRNA expression values for each sample were calculated and expressed as relative fold changes (n = 3–4, mean ± SEM). Different letters indicate significant difference at P<0.05. (A) omy-miR-nov101-5p. (B) omy-miR-nov223-5p. (C) omy-miR-nov147-5p.