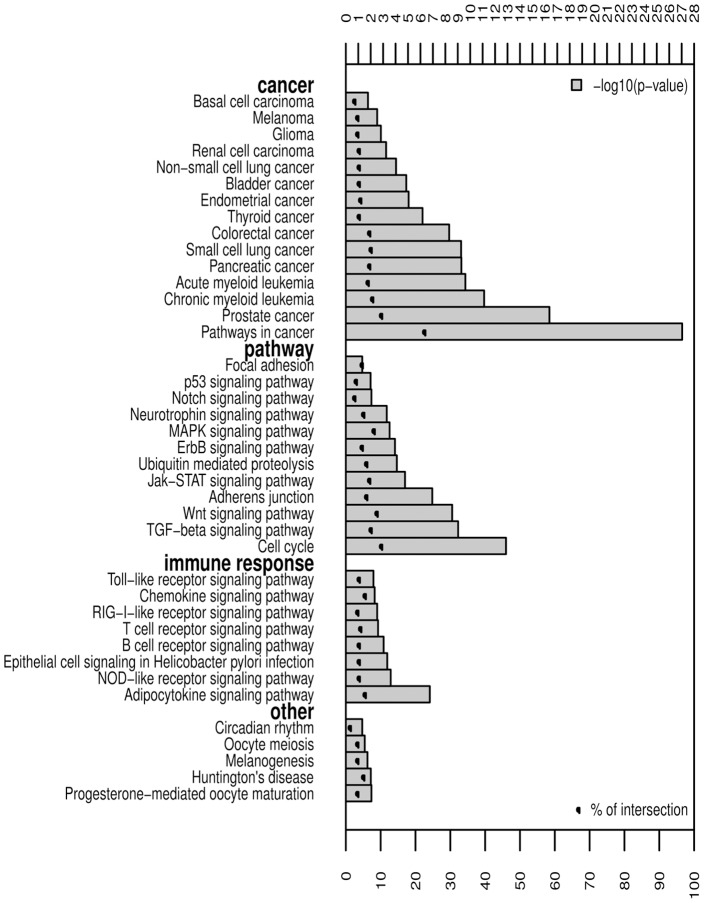
Figure 3. Signaling pathway enrichment in the MCN proteins.
All proteins (nodes) in the MCN were submitted to DAVID web tool for KEGG pathway enrichment analysis. Significant pathways are shown by categories according to the −log10(p-value) and the percentage of intersection between the submitted list and queried annotations.

