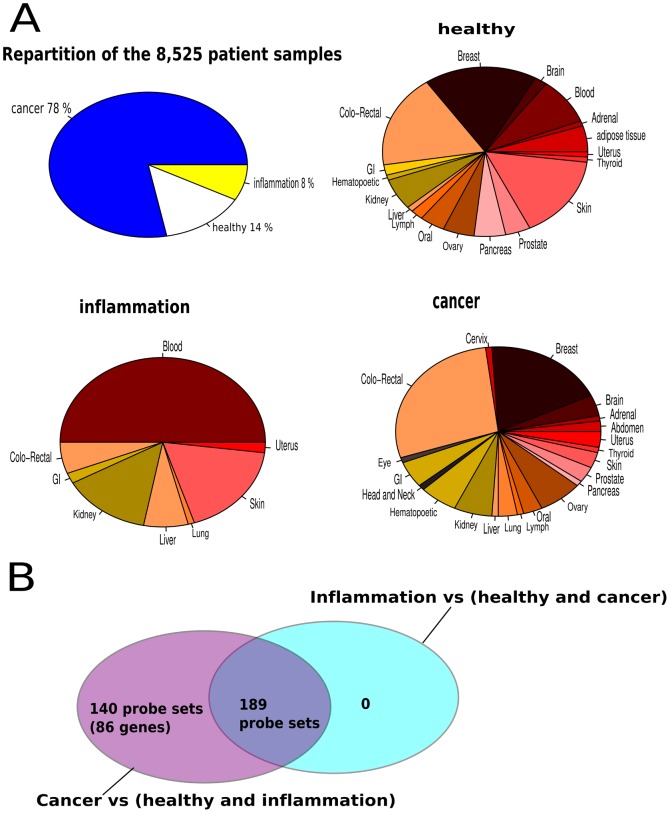
Figure 4. Patient sample repartition and cancer-specific gene expression analysis.
Microarray gene expression data representing 8,525 patients samples were downloaded from GEO. A- 78% of patients had different cancer types; 14% are healthy individual and were sampled from different tissues; 8% of patients had inflammation/sepsis and were investigated from the whole blood and other tissues. B- differential expression of the MCN top ten central TFs target gene list coding for secreted and transmembrane proteins were analyzed. Among these genes, as shown in the Venn-diagram, 140 probe sets (86 unique genes) were found to be cancer-specific. GI: Gastro-intestinal.

