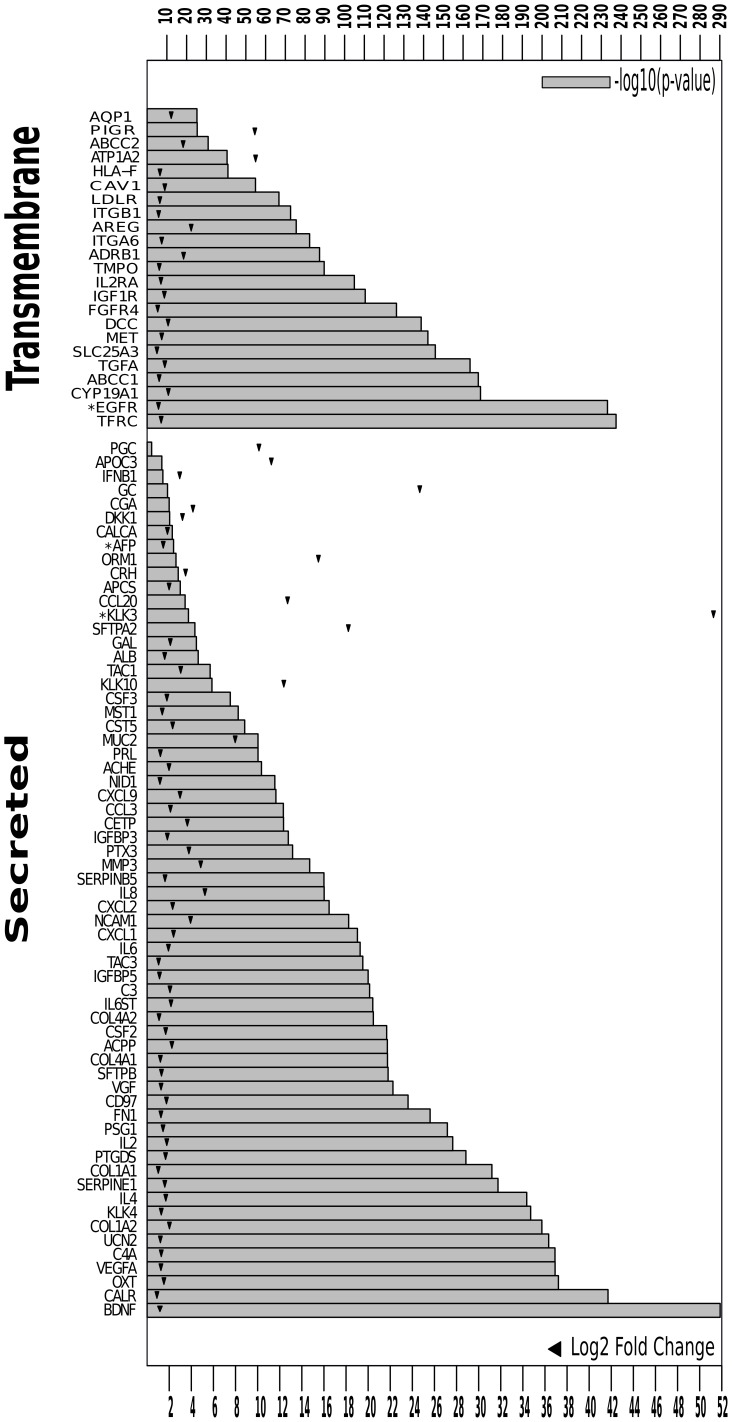
Figure 5. Significant cancer-specific biomarkers from patient gene expression analysis.
Cancer-specific gene expression significance and fold change. Significance was attested by B-H p-value correction, and all shown genes have B–H p-value< = 0.05. Bar-plots show the −log10(uncorrected p-value). Triangles show the logged fold change of the corresponding gene in cancer compared to healthy and inflammation patient phenotypes. FDA approved cancer biomarkers are marked with (*).

