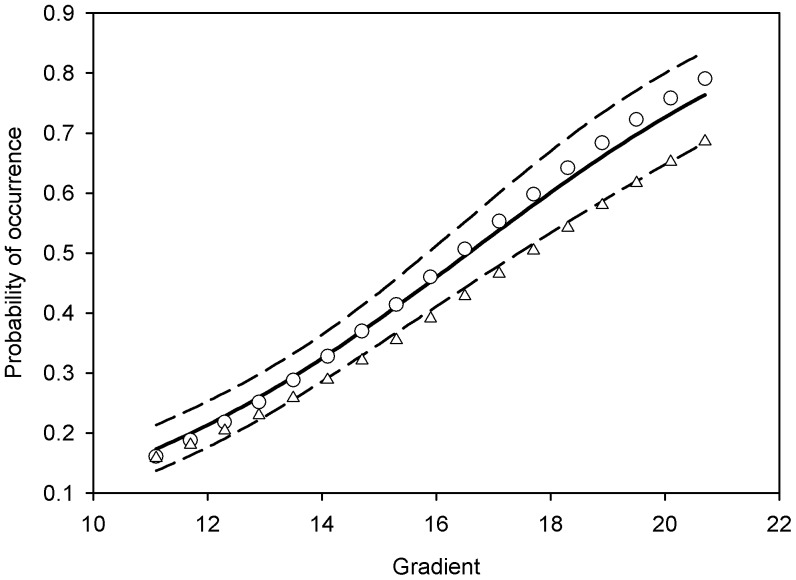
Figure 6. Relationship between the temperature gradient and the probability of occurrence.
Solid line corresponds to the relationship between the temperature gradient and the probability of occurrence obtained from Model 2; dashed lines correspond to the 95% CI. Circles represent the relationship between the temperature gradient and the probability of occurrence based on the true locations of the balls, triangles indicate the relationship obtained from the maximum count.

