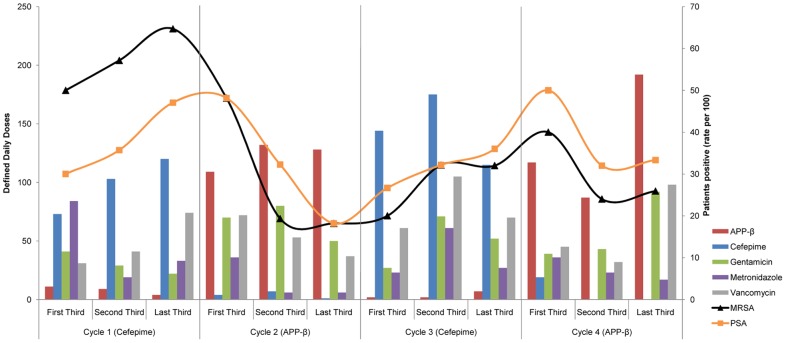
Figure 3. Antibiotic treatment and P. aeruginosa and MRSA colonisation rates.
Total defined daily doses of selected antibiotics in cycle thirds in patients admitted to ICU within 48 h of hospital arrival and received only cefepime or APP-β, or no antibiotics at all, by the end of their first week in ICU (vertical bars; left axis), with incidence rates (solid lines; right axis) of unique isolation of MRSA (triangles) and P. aeruginosa (squares) from commensal sites (ie. colonisation rates, per 100 admissions).

