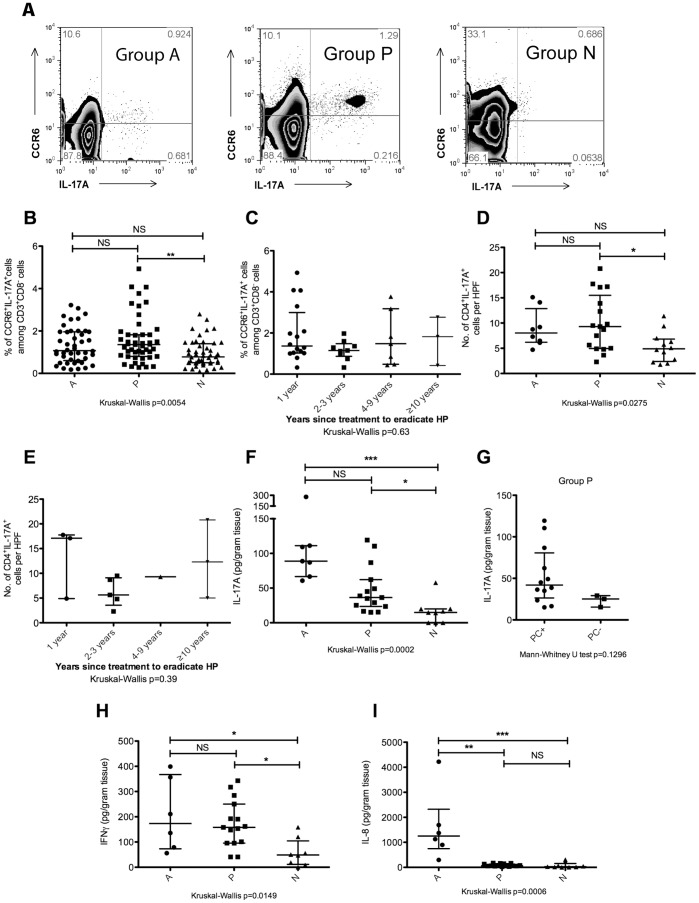
Figure 1. Elevated frequencies of cells that express IL-17A persist in individuals with past HP infection.
(A) The percentage of CD3+CD8−CCR6+IL-17A+ cells as a function of CD3+CD8− PBMCs was assessed by flow cytometry. PBMCs were activated with PMA and ionomycin for 5 hours in the presence of GolgiStop. Cells were stained for cell surface CD3, CD8, and CCR6, fixed, permeabilised, and stained for intracellular IL-17A. Th17 cells were defined as CCR6+IL-17A+ events within the CD3+CD8− compartment. Representative flow cytometry plots of individuals from group A, P, and N have been depicted. (B) Scatter plot of CD3+CD8−CCR6+IL-17A+ cells as a percentage of CD3+CD8− cells among PBMCs that had been stimulated with PMA and ionomycin. Group A (n = 44), group P (n = 47), and group N (n = 48). The median and interquartile ranges have been represented on the scatter plot as horizontal bars. (C) The frequency of CD3+CD8−CCR6+IL-17A+ events within the CD3+CD8− compartment for individuals from group P divided according to years since HP treatment. 1 year (n = 13), 2–3 years (n = 9), 4–9 years (n = 7), and ≥10 years (n = 3). (D) Number of CD4+IL-17A+ cells per high powered field (HPF) in gastric biopsy samples. Immunofluorescence microscopy was performed on gastric biopsies obtained from 8 patients in group A, 17 patients in group P, 12 patients in group N. For each patient sample, ten HPFs were evaluated and the average number of CD4+IL-17A+ cells per HPF was represented on the scatter plot. (E) Number of CD4+IL-17A+ cells per HPF in samples from group P stratified according to years since HP treatment. 1 year (n = 3), 2–3 years (n = 5), 4–9 years (n = 1), and ≥10 years (n = 3). (F − I) Cytokine concentrations in clarified homogenate obtained from mechanically disrupted gastric biopsy samples were measured using the MILLIPLEX® xMAP® bead-based cytokine quantification assay. (F) IL-17A concentration in gastric biopsy samples obtained from patients in group A (n = 7), group P (n = 15), and group N (n = 9). (G) IL-17A concentration in gastric biopsy samples from group P individuals depicted in (F) who were further sub-grouped based on the presence (PC+) or absence (PC−) of histological evidence of pre-cancerous lesions (chronic atrophic gastritis or intestinal metaplasia) in the gastric mucosa. PC+ (n = 12), PC− (n = 3). (H) IFNγ concentration in gastric biopsy samples obtained from patients in group A (n = 7), group P (n = 15), and group N (n = 9). (I) IL-8 concentration in gastric biopsy samples obtained from patients in group A (n = 7), group P (n = 15), and group N (n = 9). NS: not significant, *p<0.05, **p<0.001, ***p<0.0001.

