
Figure 2. IL-22 expression in the gastric mucosa.
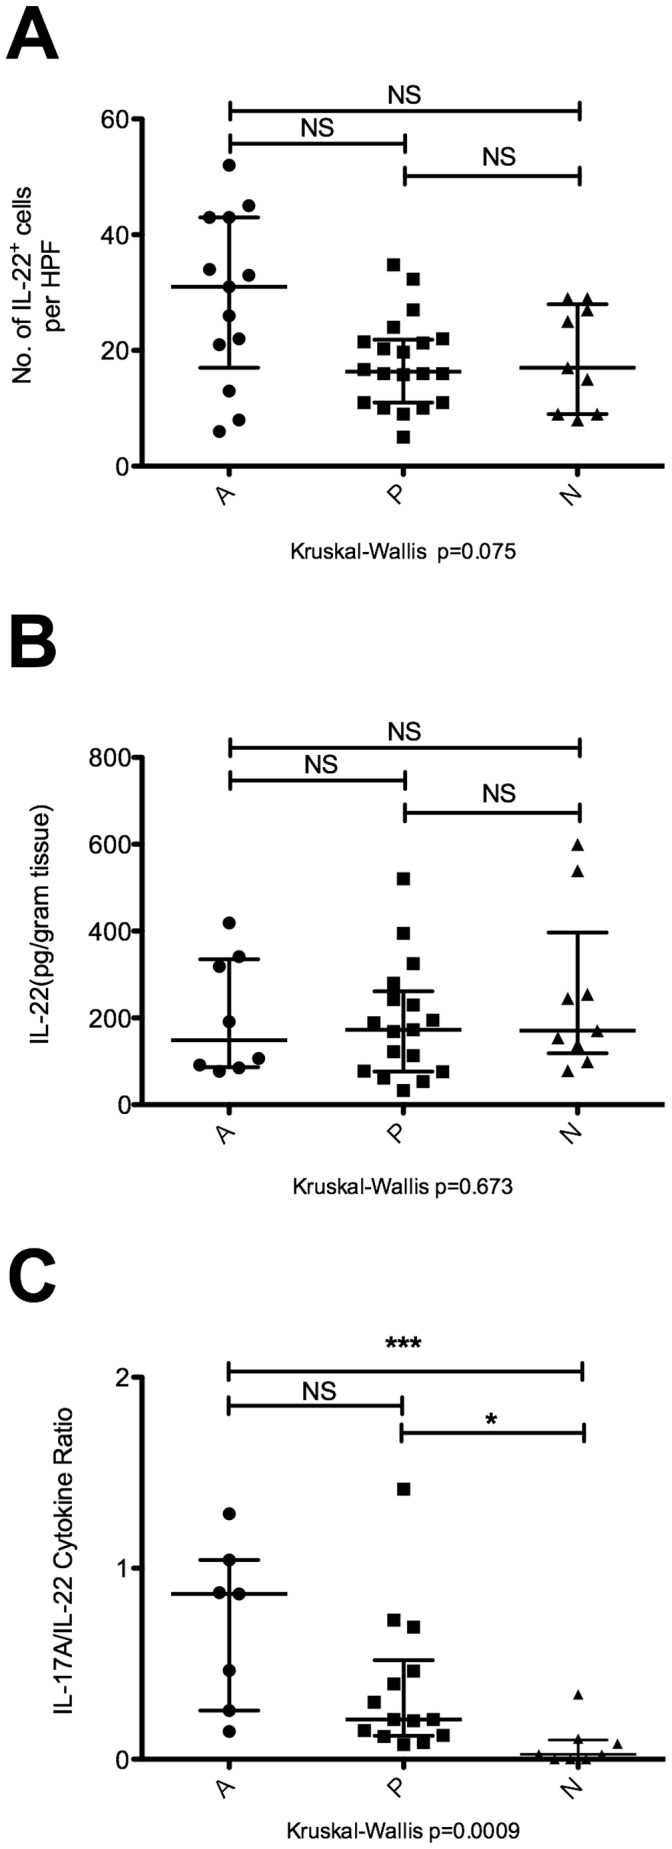
(A) Number of IL-22+ cells per high powered field (HPF) in gastric biopsy samples. Immunofluorescence microscopy was performed on gastric biopsies obtained from 13 patients in group A, 20 patients in group P, and 9 patients in group N. Ten HPFs were evaluated per sample, and the average number of IL-22+ cells per HPF was represented on the scatter plot. (B) Ex vivo concentration of IL-22 in gastric biopsies. Cytokine concentrations in clarified homogenate obtained from mechanically disrupted gastric biopsy samples were measured by ELISA. Group A (n = 8), group P (n = 17), and group N (n = 9). (C) The ratio of gastric mucosal IL-17A to IL-22 was determined by dividing the concentration of IL-17A in gastric mucosal homogenate with the concentration of IL-22 found in the same biopsy sample obtained from a given individual. Group A (n = 7), group P (n = 14), and group N (n = 8). NS: not significant, *p<0.05, ***p<0.0001.