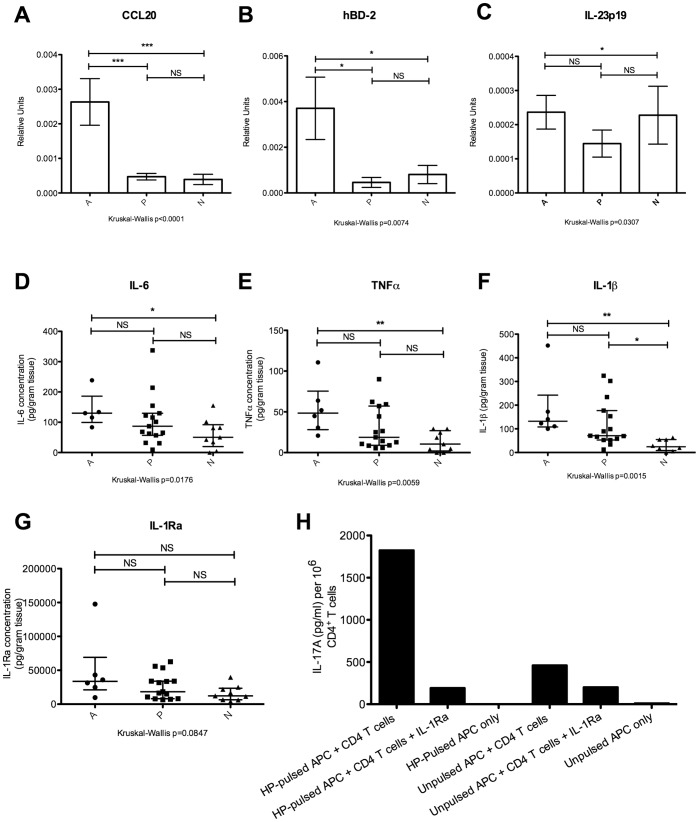
Figure 4. Gastric mucosal expression of cytokines that modulate Th17 responses.
(A) Semi-quantitative real-time PCR was used to determine gene expression of CCL20 in gastric biopsy samples, normalised to expression of β-actin. Group A (n = 17), group P (n = 27), group N (n = 20). (B) Semi-quantitative real-time PCR was used to determine gene expression of hBD-2 in gastric biopsy samples, normalised to expression of β-actin. Group A (n = 16), group P (n = 11), and group N (n = 12). (C) Semi-quantitative real-time PCR was used to determine gene expression of IL-23p19 in gastric biopsy samples, normalised to expression of β-actin. Group A (n = 15), group P (n = 31), and group N (n = 30). (D – G) Ex vivo protein concentrations of IL-6, TNF-α, IL-1β, and IL-1Ra in homogenised gastric biopsy samples were measured by MILLIPLEX® xMAP® bead-based cytokine quantification assay. Group A (n = 6), group P (n = 14), and group N (n = 7). (H) IL-1 receptor antagonist blocks IL-17A production by CD4+ T cells co-cultured with HP-pulsed APCs. PBMCs obtained from a group P individual were pulsed with HP and prepared as in figure 3B for use as APCs. These APCs were co-cultured for 48 hours with purified autologous CD4+ T cells at a ratio of 5 APCs: 1 CD4+ T cell, either in the absence or presence of IL-1Ra (final concentration 200 ng/ml). IL-17A levels in culture supernatant were measured using ELISA. Representative data from 1 of 2 independent experiments has been depicted. NS: not significant, *p<0.05, **p<0.001, ***p<0.0001.

