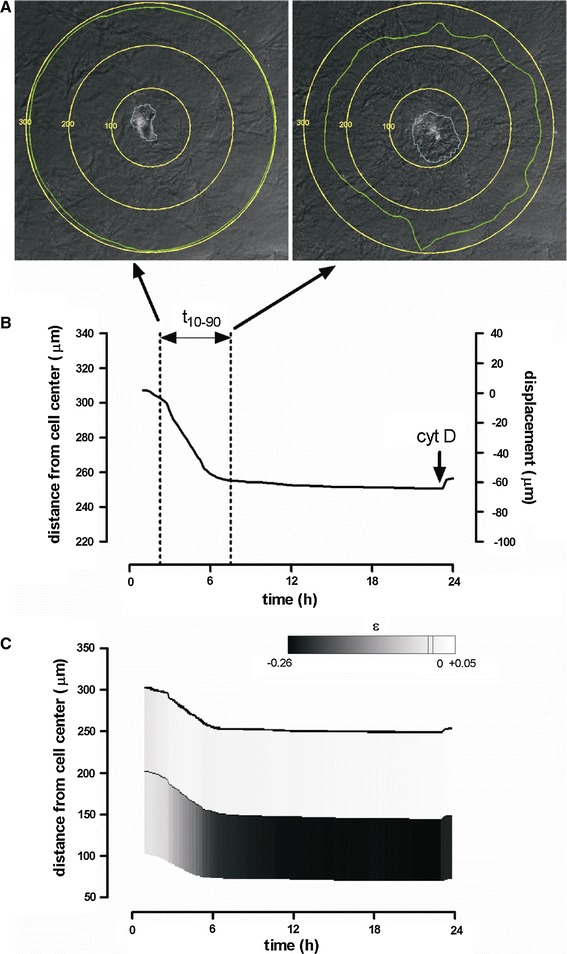
Fig. 2.

Typical compaction pattern by a single cell. a Images acquired after reaching 10 and 90 % of the total compaction. Cell edge is depicted in blue, displacement of matrix situated initially on a circle at 300 μm from the center of the cell is followed in time (green line). b Average displacement in time of a point situated initially at 300 μm from the center of the cell. c Mean displacement of matrix originally situated at three distances: 100, 200 and 300 μm (yellow circles in a). Strain is given by a gray scale; white depicts expansion and black depicts compression (color figure online)
