Fig. 1.

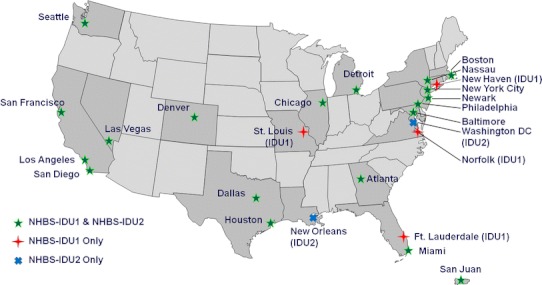
Map of NHBS-IDU1 and NHBS-IDU2 sampling sites by participating cycle. Cycle for which data are available is shown in parenthesis next to city names. If no cycle is shown, data are available for both NHBS-IDU1 and NHBS-IDU2

Map of NHBS-IDU1 and NHBS-IDU2 sampling sites by participating cycle. Cycle for which data are available is shown in parenthesis next to city names. If no cycle is shown, data are available for both NHBS-IDU1 and NHBS-IDU2