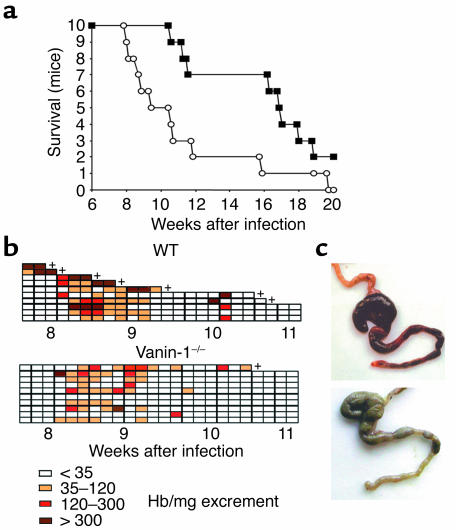
Figure 3.
Prolonged survival of S. mansoni–infected Vanin-1–/– mice. (a) Survival curves of Vanin-1–/– (square) and WT (circle) mice infected with a lethal dose of S. mansoni cercariae. From 8 to 12 weeks after infection, hemoglobin amount in feces was assayed daily. (b) Reduced intestinal hemorrhages in Vanin-1–/– mice following S. mansoni infection. Daily quantification of the Hb amount in infected Vanin-1–/– and WT mice feces. Color scale indicates Hb amount, namely less than 35, 35–120, 120–300, and more than 300 ng Hb/mg excrement. +, dead mice. (c) Typical aspect of cecum and colon of WT mice (top) and Vanin-1–/– mice (bottom). Scale bars, 1 cm.

