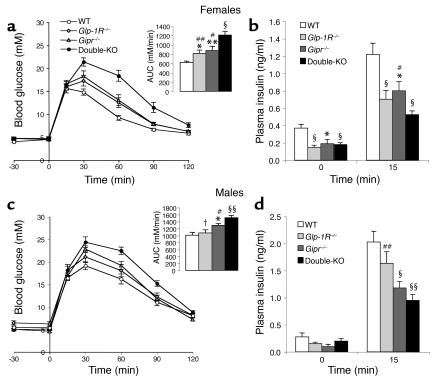
Figure 2.
Oral glucose tolerance tests (3 mg/g) in 3- to 4-month-old mice. (a and c) Glycemic excursions for (a) female WT (n = 11), Glp-1R–/– (n = 6), Gipr–/– (n = 9), and double-KO mice (n = 11) and for (c) male mice (n = 12–19). Insets: quantification of the glycemic excursions as AUC. (b and d) Basal and peak plasma insulin levels 15 minutes after gavage for (b) female WT (n = 12), Glp-1R–/– (n = 17), Gipr–/– (n = 12), and double-KO mice (n = 9), and for (d) males (n = 9–13). Data pooled from two to four separate experiments are expressed as means ± SE. *P < 0.05, **P < 0.01, §P < 0.005, §§P < 5 × 10⁻⁴ vs. WT controls; #P < 0.05, ##P < 0.01, †P < 0.005 vs. double-KO.

