Figure 4.
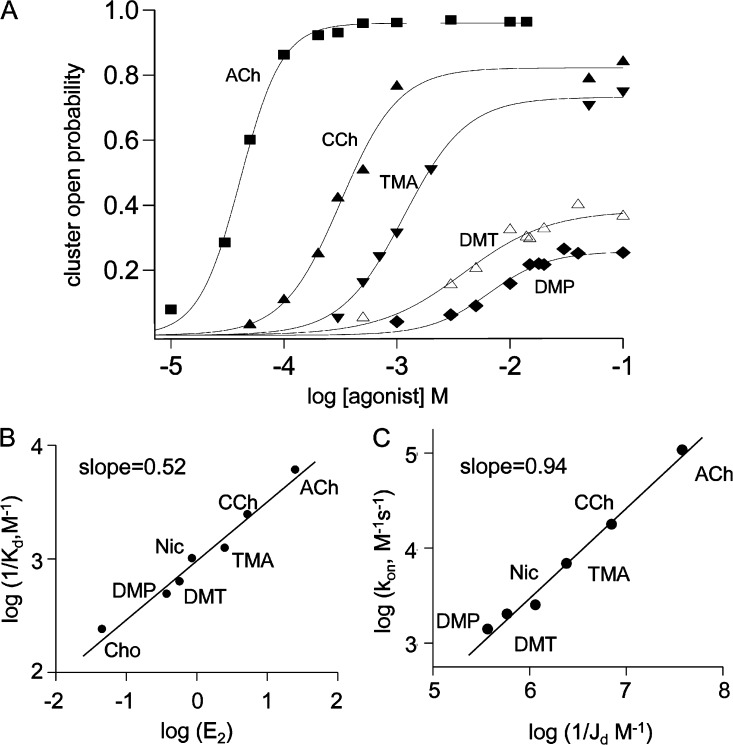
Affinity–efficacy correlation for agonists. (A) The probability of being open within a cluster (Po) versus agonist concentration. Agonists with higher maximum Po values have lower EC50 values (Table 4). Agonist structures are shown in Fig. 1 E. (B) Logarithmic plot of 1/Kd (resting affinity) versus E2 (efficacy). Agonists that open the channel more effectively (have higher E2 values) also bind to resting AChRs with higher affinity (higher 1/Kd values). Slope = 0.52 ± 0.03, intercept = −3.02 ± 0.03. (C) On a log–log scale, the LA association rate constant (kon) is closely correlated with the equilibrium constant for HA binding (1/Jd).

