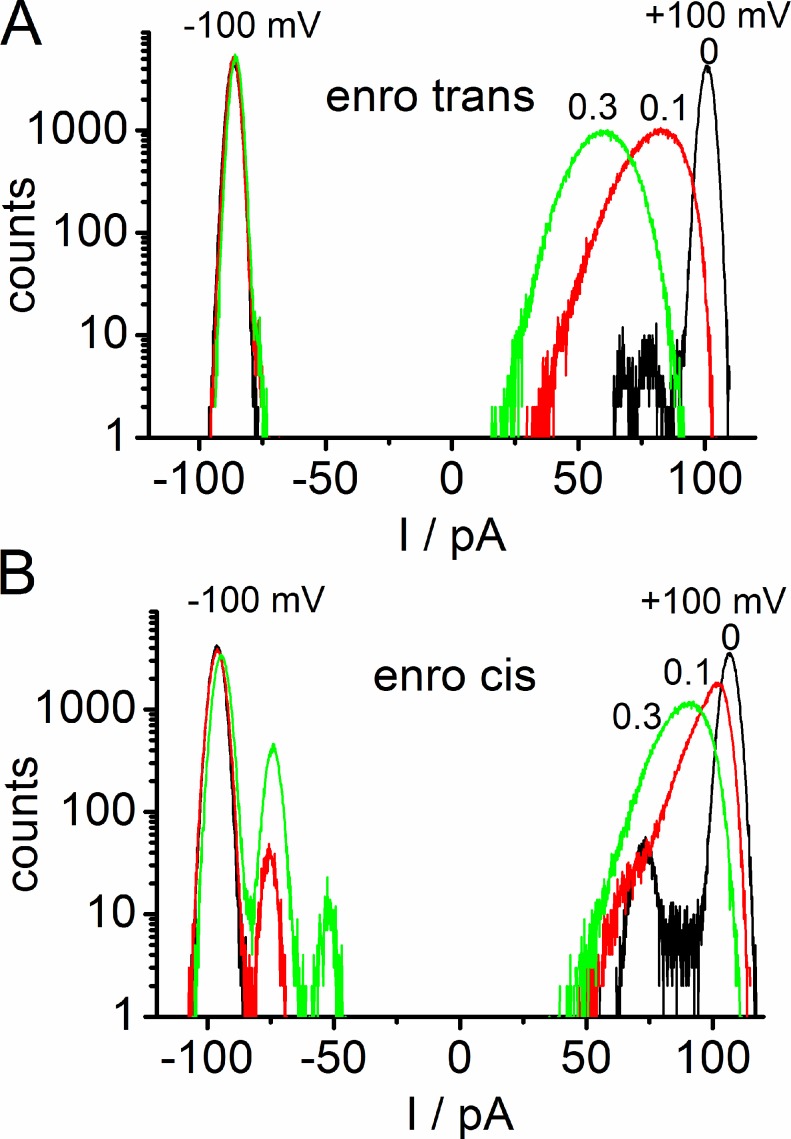
Figure 4.
Amplitude histograms from representative time series of OmpF in an asymmetrical LPS membrane similar to those in Fig. 2 with enrofloxacin given on the trans side (A) and the cis side (B) at −100 mV and +100 mV. Black lines are the controls with zero enrofloxacin, red with 0.1 mM enrofloxacin, and green with 0.3 mM enrofloxacin.

