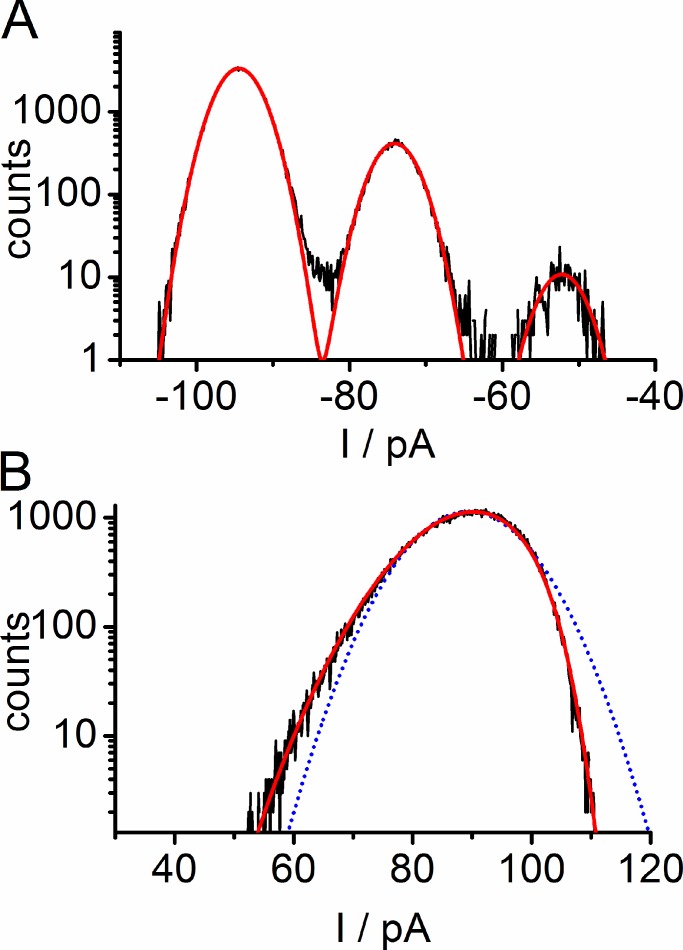
Figure 6.
Examples for fitting of amplitude histograms in the presence of 0.3 mM enrofloxacin on the cis side in an LPS membrane. Data are taken from Fig. 4 B. (A) Successful fitting of Gaussians (red) to an all-point amplitude histogram with slow blocking measured at −100 mV resulting in σ0 = 2.6 pA and an estimated single-pore current Iapp = 20.8 pA. (B) Failure of fitting an open-point histogram measured at +100 mV by a Gaussian distribution (blue dotted line). Successful fitting of the data with a β distribution (red solid line) resulting in Itrue = 22.7 pA, IB = 12 pA, kOB = 20 700 s-1, and kBO = 67 000 s-1 (Eq. 1, Figs. 1 C and 5).

