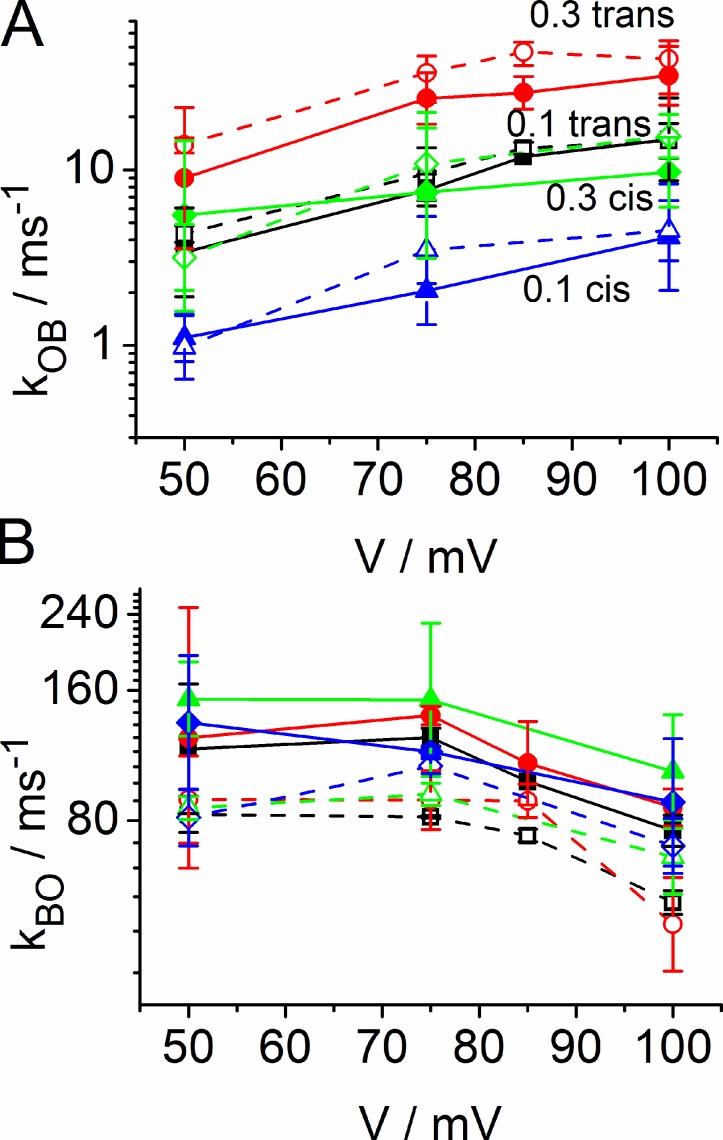
Figure 9.
Voltage dependence of the rate constants of blocking (A, kOB) and unblocking (B, kBO) of the enrofloxacin-induced fast block (same set of experiments as in Fig. 8 and Table 1). Open symbols and dashed lines present data from LPS, and closed symbols and solid lines those from DPhPC. Red circles: 0.3 mM enrofloxacin trans; black squares: 0.1 mM trans; green diamonds: 0.3 mM cis; blue triangles: 0.1 mM cis. Symbols show mean and standard error, and the number of experiments is given in Table 1.

