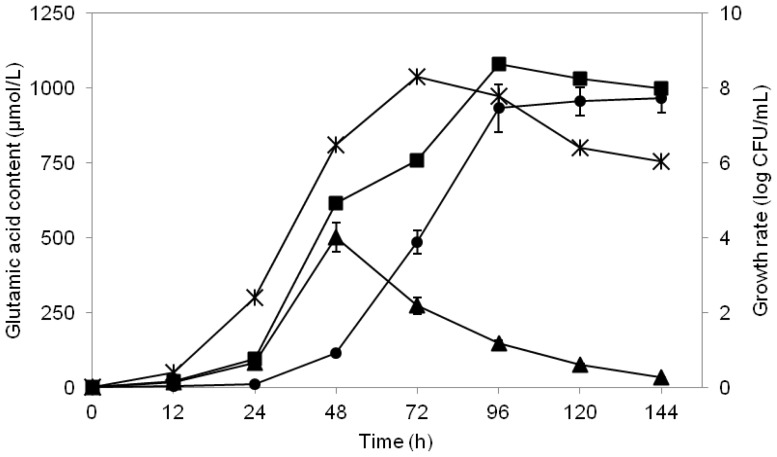
Figure 6.
Changes in extra-cellular and intra-cellular glutamic acid content produced by Lactobacillus plantarum MNZ cultured in MRS medium supplemented with 12% glucose at 30 °C. Symbols used were: (▴) Intra-cellular glutamic acid; (●) extra-cellular glutamic acid; (■) total glutamic acid; (×) growth profile. Values are mean ± standard deviation of three independent experiments.

