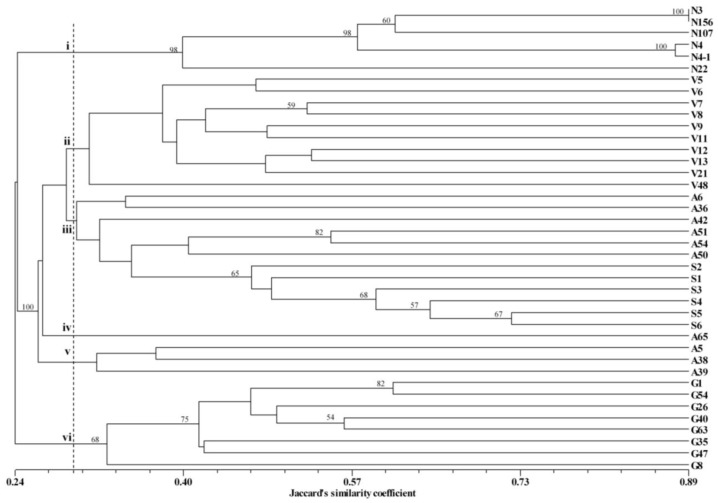
Figure 2.
Dendrogram of the cultivated bromeliad accessions, derived from the UPGMA cluster analysis based on Jaccard’s similarity coefficients. The codes refer to Table 1. Numbers on the branches are bootstrap values obtained from 1000 re-samplings, only the bootstrap values > 50% were provided.

