Figure 3.
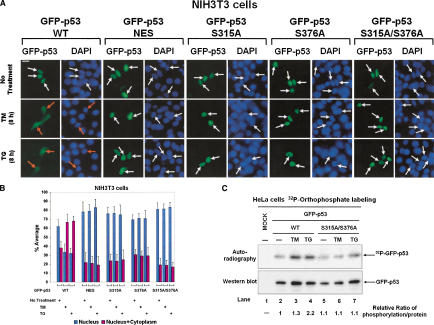
Phosphorylation-dependent cytoplasmic localization of p53 in ER-stressed cell. (A) Subcellular localization of GFP-p53. Plasmid DNA (0.5 μg) containing either GFP-p53 WT or each of the indicated GFP-p53 mutants was transiently transfected into NIH-3T3 cells. Twenty-four hours later, cells were left untreated or treated with either 10 μg/mL of TM or 1 μM of TG for 8 h, and then examined for GFP-p53 fluorescence. Cell nuclei were visualized by staining with DAPI. White arrows indicate nuclear localization of GFP-p53 only, whereas orange arrows indicate either cytoplasmic or both cytoplasmic and nuclear localization of GFP-p53. (B) Quantitative analysis of GFP-p53 localization. For each condition, 1000 GFP-p53 positive and live cells were scored. Cells were classified into two groups as follows: the first with predominantly nuclear p53 (blue bars) and the second with p53 both in the nucleus and cytoplasm (red bars). Values are means ± SD from six separate experiments. (C) Induced phosphorylation of GFP-p53 by ER stress in vivo. HeLa cells were transfected with 1 μg of either GFP-p53 WT or GFP-p53 S315A/S376A plasmid DNA. Twenty-four hours later, cells were subjected to [32P]orthophosphate labeling followed by immnunoprecipitation of 500 μg of protein extracts with anti-p53 rabbit polyclonal antibody. Half of the immunoprecipitates were subjected to SDS-PAGE and autoradiography (top; 4 h exposure), the other half to immunoblotting with anti-p53 polyclonal antibody followed by ECL detection for 30 sec (bottom). The relative ratio of p53 phosphorylation was calculated by normalizing the intensity of phosphorylated p53 to the intensity of total p53 protein detected by ECL.

