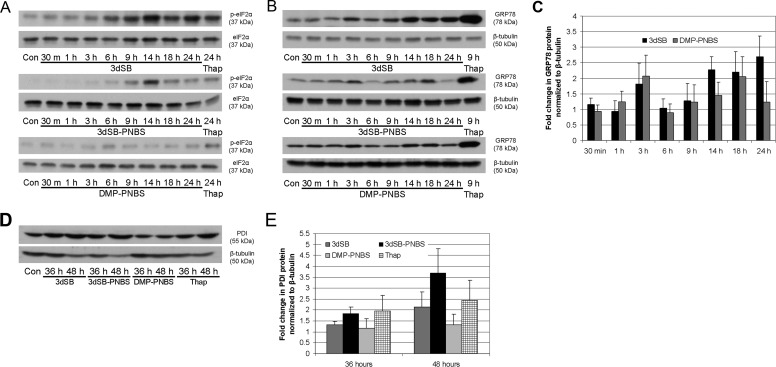
Fig. 5.
Induction of eIF2α phosphorylation and up-regulation of GRP78 and PDI by 3dSB and 3dSB-PNBS. A, time course of eIF2α phosphorylation. SF-295 cells were left untreated (Con) or were treated with 3dSB (1 μM), 3dSB-PNBS (1 μM), or DMP-PNBS (10 μM) for the indicated times (30 min to 24 h). As a positive control, cells were treated with thapsigargin (Thap) (5 μM) for 24 h. B, time course of GRP78 expression. SF-295 cells were treated as in A with the exception of thapsigargin, which was treated for 9 h. Blots were probed with anti-GRP78 and anti-β-tubulin antibodies. C, quantification of GRP78 protein levels, normalized with respect to β-tubulin levels, after incubation with 3dSB (1 μM) or 3dSB-PNBS (1 μM) for times ranging from 30 min to 24 h. The graph displays GRP78 protein levels (mean ± S.D.) from three independent experiments. D, effects of schweinfurthin treatment on PDI expression. SF-295 cells were left untreated (Con) or were treated with 3dSB (1 μM), 3dSB-PNBS (1 μM), DMP-PNBS (10 μM), or thapsigargin (5 μM) for 36 or 48 h. Blots were probed with anti-PDI and anti-β-tubulin antibodies. E, quantification of PDI levels, normalized with respect to β-tubulin levels, after incubation with 3dSB (1 μM), 3dSB-PNBS (1 μM), DMP-PNBS (10 μM), or thapsigargin (5 μM) for 36 or 48 h. The graph displays PDI protein levels (mean ± S.D.) from three independent experiments.

