Fig. 5.

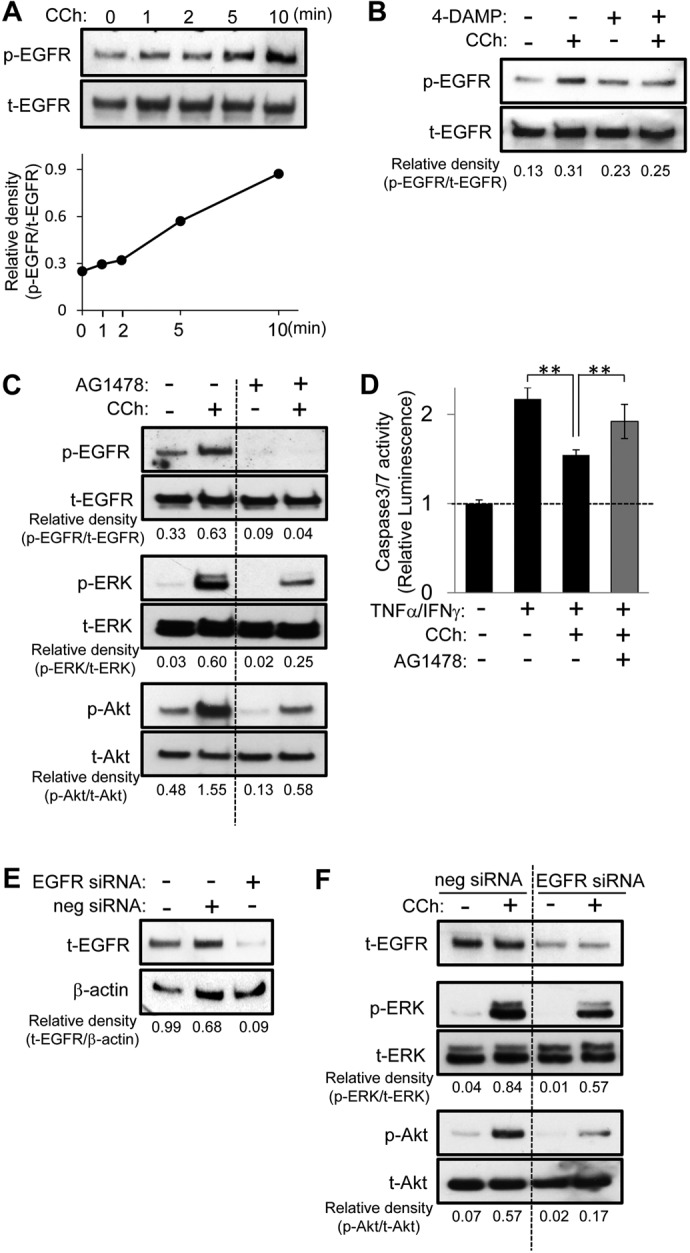
EGFR transactivation is involved in CCh-induced cell survival signaling. A, HSG cells were exposed to CCh (100 μM) for the indicated times. The phosphorylated (p) and total (t) EGFR levels were analyzed through immunoblotting. B and C, HSG cells were pretreated with or without 1 μM 4-DAMP (B) or 5 μM AG1478 (C) for 30 min and then were exposed to CCh (100 μM) for 5 min. The phosphorylated and total EGFR, ERK, and Akt levels were analyzed through immunoblotting. D, HSG cells were pretreated with or without AG1478 (5 μM) for 30 min. The cells then were treated with or without 100 μM CCh, in the absence or presence of TNFα (50 ng/ml)/IFNγ (10 ng/ml), and were incubated for 24 h. Caspase 3/7 activity was indicated by luminescence activity, as described under Materials and Methods. Values represent the mean ± S.D. of three cultures. **, p < 0.01, values differ significantly (t test). E, HSG cells, having been transfected with negative control (neg) or EGFR siRNA, were cultured for 48 h in medium A. The levels of EGFR and β-actin in the cells were analyzed through immunoblotting. F, HSG cells, having been transfected with negative control or EGFR siRNA, were cultured for 48 h in medium A and then were exposed to CCh (100 μM) for 5 min in medium B. The phosphorylated and total ERK, Akt, and EGFR levels were analyzed through immunoblotting. Quantification of the band density was performed through densitometric scanning of each band by using National Institutes of Health ImageJ software.
