
Fig. 4.
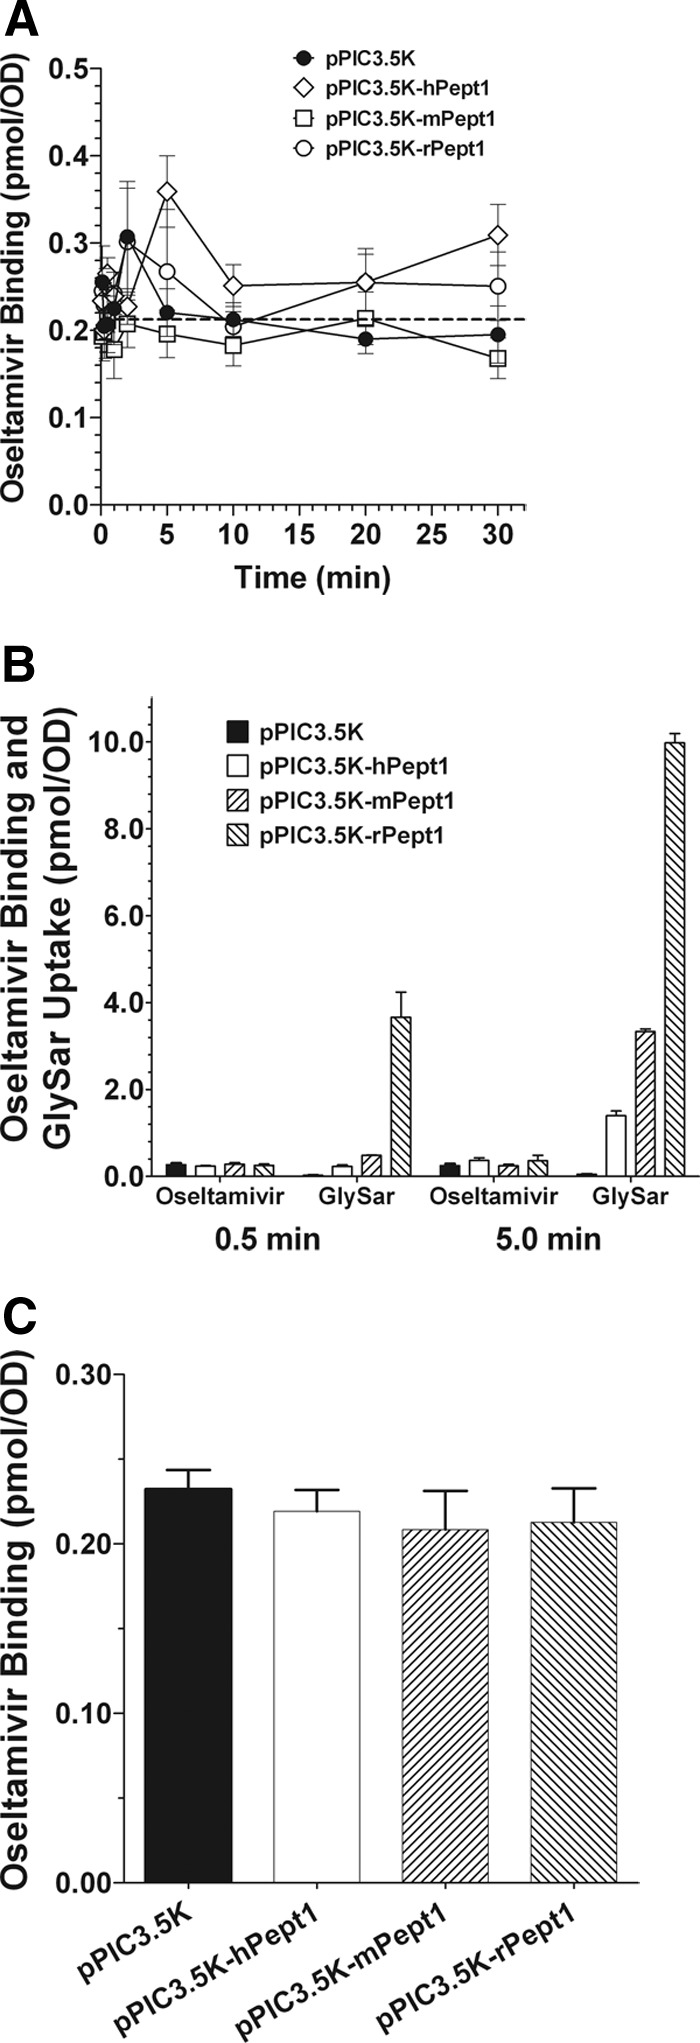
Binding of 5.0 μM [14C]oseltamivir versus time in P. pastoris expressing human (pPIC3.5K-hPept1), mouse (pPIC3.5K-mPept1), and rat (pPIC3.5K-rPept1) PEPT1 and vector control (pPIC3.5K) (A); comparative studies evaluating the binding of 5.0 μM [14C]oseltamivir and uptake of 5.0 μM [3H]GlySar, at 30 s and 5 min, in PEPT1 mammalian species and vector control (B); nonspecific binding of oseltamivir as determined at 0°C and 0 time (C). In contrast, the studies in A and B were performed at 24°C. In A, GlySar uptake was run as a positive control in all studies, and in B, the uptake of GlySar and binding of oseltamivir were conducted in parallel at the same time. pH 6.5 buffer was used throughout the experiments. Data are expressed as means ± S.E. (n = 6). The dashed line in A represents the average value for nonspecific binding of oseltamivir to yeast (i.e., at 0°C and 0 time).