Figure 3.
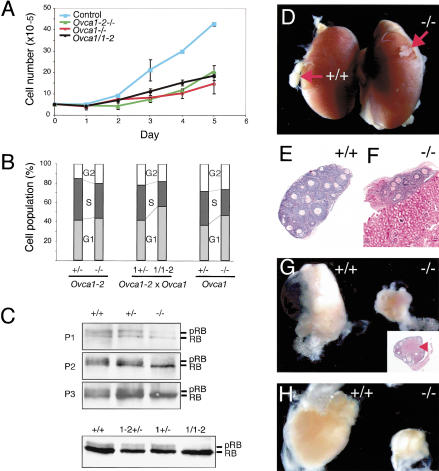
Ovca1 mutant MEF cell cycle analysis and ovary grafts. (A) Growth dynamics of Ovca1 mutant MEFs. Genotypes are indicated in upper left corner: (Control) wild-type or Ovca1+/-. (B) Histogram showing the percentage of the MEF population in G1 (G0/G1), S, and G2 (G2/M). (C) Western blot showing RB and its phosphorylation (pRB) status in Ovca1 mutant MEFs. Analysis of passages 1 to 3 (P1, P2, P3) was derived from Ovca1+/+ (+/+), Ovca1+/- (+/-), and Ovca1-/- (-/-) embryos. Analysis of MEFs at passage 4 (P4) was derived from embryos obtained from Ovca1+/- × Ovca1-2+/- matings. (D) Gross morphology of Ovca1-2+/+ (+/+) and Ovca1-2-/- (-/-) ovaries (arrows) grown under the kidney capsule for 1 mo. (E,F) Histology of wild-type and Ovca1-2-/- ovary grafts shown in D. (G) Gross morphology of wild-type and Ovca1-2-/- ovaries grown in the ovarian bursa for 3 mo. (Inset) Histology of the 3-mo-old Ovca1-2-/- ovary graft. Corpus luteum (arrowhead) indicates ovulation. (H) Gross morphology of wild-type and Ovca1-2-/- ovaries grown in the ovarian bursa for 9 mo.

