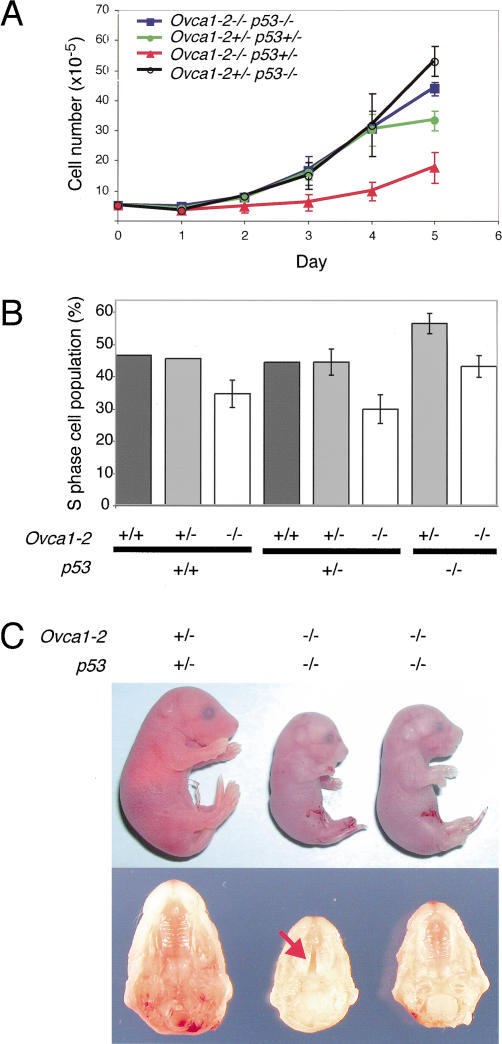
Figure 4.
Effect of p53-deficiency on Ovca1 mutant MEF growth and embryo development. (A) Growth dynamics of Ovca1 mutant MEFs. Genotypes are indicated in the upper left corner. (B) Percentage of S-phase cell population derived from MEFs with various Ovca1 and p53 genotypes. Two to three independent MEF lines were analyzed (Ovca1-2+/+ p53+/+, n = 2; Ovca1-2+/- p53+/+, n = 2; Ovca1-2-/- p53+/+, n = 3; Ovca1-2+/+ p53+/-, n = 2; Ovca1-2+/- p53+/-, n = 3; Ovca1-2-/- p53+/-, n = 3; Ovca1-2+/- p53-/-, n = 3; Ovca1-2-/- p53-/-, n = 3). (C) Gross morphology of E18.5 cis Ovca1-2+/- p53+/- pup (left) and Ovca1-2-/- p53-/- pups (two pups on the right; top); normal palate fusion was found in 50% of Ovca1-2-/- p53-/- pups (n = 4; representative shown at right) in comparison to cleft palate (arrow) found in 50% of the same genotype (n = 4, representative shown in the middle). Normal palate morphology of representative cis Ovca1-2+/- p53+/- littermate (n > 4) is shown at the left as a control.

