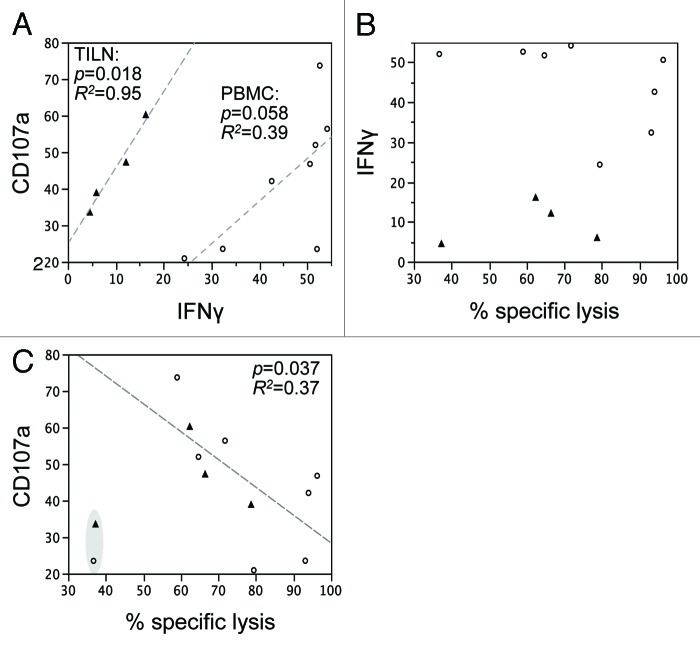
Figure 4. Apparent discrepancy between functional parameters. Correlation analysis of functional parameters measured following Ag-specific stimulation of Melan-A-specific cells isolated from either PBMC (open circles) or TILN (closed triangles). (A) CD107a vs. IFNγ. (B) IFNγ vs. % specific lysis. (C) CD107a vs. % specific lysis. The outliers highlighted in gray have been excluded from the statistical analysis of CD107a vs. % specific lysis, as they had very low lytic capacity.

An official website of the United States government
Here's how you know
Official websites use .gov
A
.gov website belongs to an official
government organization in the United States.
Secure .gov websites use HTTPS
A lock (
) or https:// means you've safely
connected to the .gov website. Share sensitive
information only on official, secure websites.
