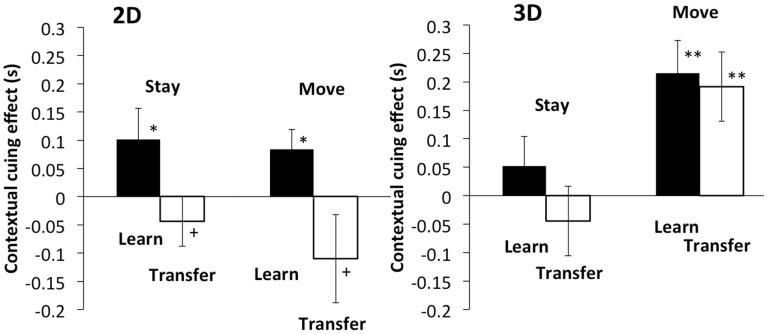
Figure 9.
Left and right panels show the results of 2D and 3D stimuli, respectively. The vertical axis indicates the difference in reaction time between the novel and repeated configurations. The black bar shows the result of the last two epochs of the learning phase, and the white bar shows the result of the epochs of the transfer phase. Error bars represent standard error across participants.

