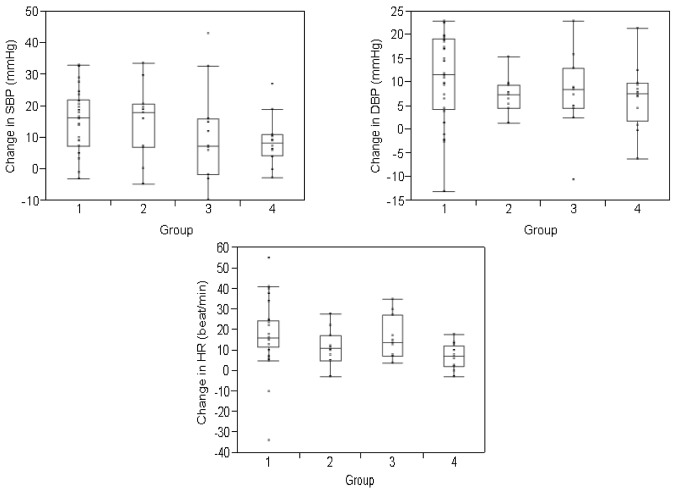
Figure 1.
Change in blood pressure and heart rate during the infusion. Change represents the mean difference between the measured variables (systolic blood pressure (SBP), diastolic blood pressure (DBP), and heart rate (HR) at baseline and the maximum value attained during the study period. BP and heart rate were measured every 15 minutes for the first hour and then once hourly for a total of 4 hours in healthy volunteers and for a total of 8 hours or until the infusion was complete, whichever longer, in transplanted subjects. Values are divided according to study group. The change in blood pressure and heart rate was not significantly different among groups. The boxes represent the 25th and 75th percentiles and border the median horizontal lines. The top and bottom horizontal lines represent the maximum and minimum values, excluding outliers.

