
Figure 4.
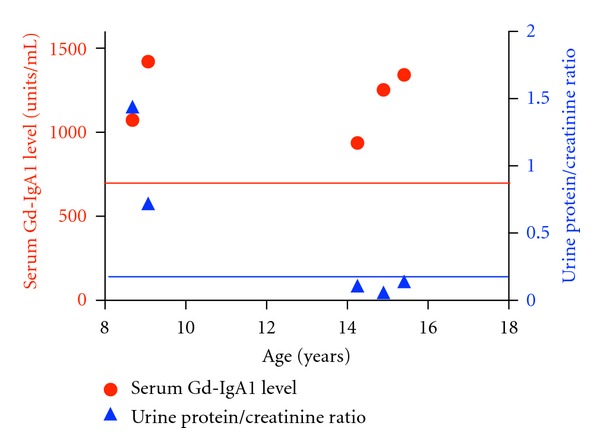
Serum Gd-IgA1 levels (red circles) and concomitant urinary protein/creatinine ratios are plotted for the patient having the most serum Gd-IgA1 determinations. The red line represents the 95th percentile for serum Gd-IgA level in healthy pediatric controls, and the blue line represents the upper limit of normal for urinary protein/creatinine ratio of 0.2. This time course is of interest in that the initial value was at presentation with gross hematuria and the last three values were obtained during clinical remission (normal urinalysis and estimated GFR).