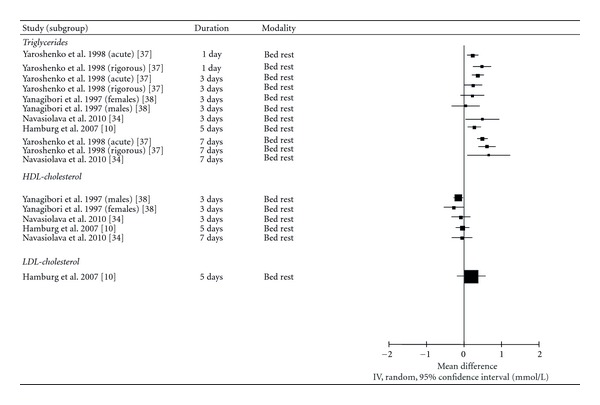
Figure 3.

Forest plot of mean differences of fasting lipid levels between sedentary behaviour and control conditions (sedentary behaviour-control).

Forest plot of mean differences of fasting lipid levels between sedentary behaviour and control conditions (sedentary behaviour-control).