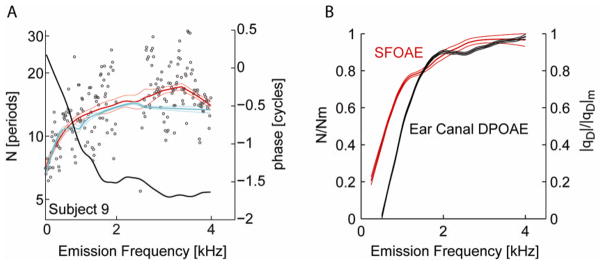
FIGURE 3.
Comparison of two OAE metrics of cochlear scaling. A. SFOAE (red) and DPOAE reflection-component (cyan) group delays (in dimensionless form) and DPOAE phase (black re: right axis) from Subject 9. Scattered circles display raw SFOAE delays. The thick and thin lines mark the loess fits with 95% CI. B. Loess trend lines (and 95% CI) fit to the group data for SFOAE delays (red) and ear canal DPOAE phase (black) on normalized axes.

