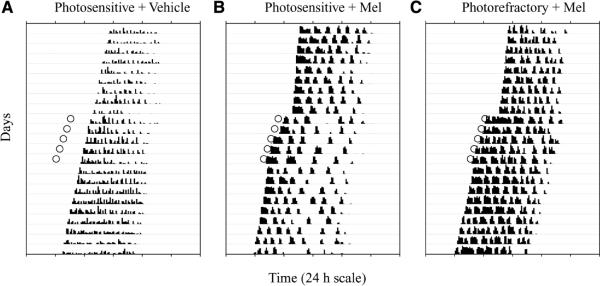
Figure 3.
Representative actograms of running wheel activity in a photosensitive hamster injected with vehicle (A), a photosensitive hamster injected with Mel (B), and a photorefractory hamster injected with Mel (C). Open circles indicate the time of injection: Mel, but not vehicle injections, caused phase advances. Hatch marks along each horizontal line represent the amount of activity (revolutions/10 min bin); each horizontal line represents 24 h, and activity records from consecutive days are plotted beneath each other. Each hamster has a free-running period <24 h, as indicated by the earlier onset of activity on consecutive days.

