Figure 3.
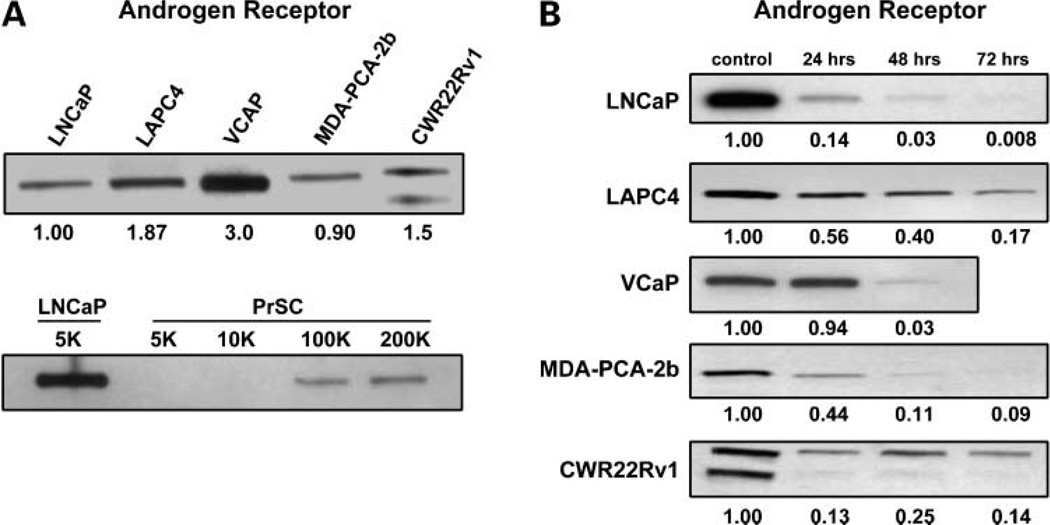
Relative level of AR protein in the various androgen ablation refractory human prostate cancer cell lines compared with each other versus normal human prostate stromal cells (PrSCs). Values below the upper gel are the relative expression normalized to LNCaP cells. In the second blot, the level of AR in 5,000 LNCaP cells is compared with 5,000 to 200,000 prostate stromal cells. Kinetics of the depletion of AR protein in the various human prostate cancer lines after exposure to 500 nmol/L TG. Values below the each gel are the relative expression normalized to control (unexposed) cells for each line.

