Fig. 4.
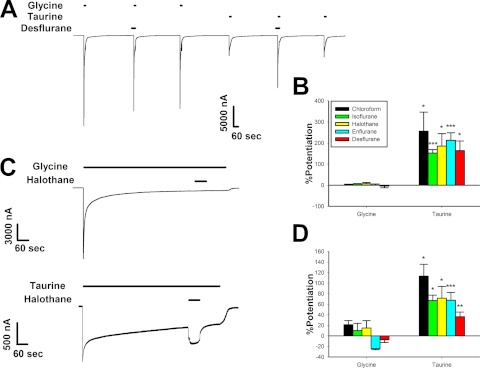
Anesthetics affect currents elicited by maximally effective concentrations of taurine but not glycine. A, sample tracing of maximally effective concentrations of glycine and taurine applied with and without 1.76 mM desflurane. The tracing shows 30-s preincubations with 1.76 mM desflurane followed immediately by 15-s applications of either 10 mM glycine or 100 mM taurine plus desflurane. Each of these applications was preceded and followed by applications of 10 mM glycine or 100 mM taurine, respectively. Horizontal bars over tracings indicate time of exposure to glycine, taurine, or desflurane. B, summary of the effects of various anesthetics on 15-s applications of maximally effective concentrations of glycine or taurine. The y-axis represents the percentage change in current observed in the presence of anesthetic compared with that produced by glycine or taurine applied alone. Data are shown as mean ± S.E.M. of six to seven oocytes for each anesthetic. C, sample tracings showing the effects of 0.5 mM halothane coapplied with saturating concentrations of glycine or taurine after the neurotransmitters had already been applied for 10 min. In the top tracing, 0.5 mM halothane was coapplied with 10 mM glycine after 10-min exposure to a saturating glycine concentration. The bottom tracing shows the same experiment, with 100 mM taurine instead of glycine. D, summary graph of the effects of various anesthetics during long applications with saturating concentrations of glycine or taurine. The y-axis represents the percentage change in current observed in the presence of anesthetic compared with the glycine or taurine current measured immediately before anesthetic coapplication. Data are shown as mean ± S.E.M. of four to eight oocytes.*, P < 0.05, **, P < 0.01, ***, P < 0.001 comparing glycine to taurine.

