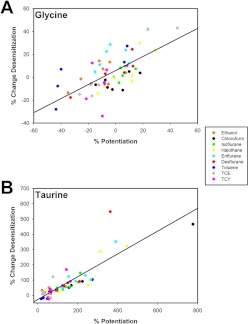
Fig. 8.
Correlation between the degree of positive allosteric modulator enhancement of peak current levels and desensitization rates. A, correlation between positive allosteric modulator effects on peak current percentage potentiation and change in desensitization rate for glycine-activated GlyR. Each data point is from a single oocyte and a single modulator according to the color key shown. The x-axis represents the percentage change in peak current produced by modulator, and the y-axis represents the percentage change in desensitization rate seen with each modulator. The solid line is a linear regression through the data set with r = 0.67. Each modulator was tested on five to seven oocytes. B, correlation between positive allosteric modulator effects on percentage potentiation and change in desensitization for taurine-activated GlyR. The axes and color coding are the same as in A. The solid line is a linear regression through the data set with r = 0.87. Each modulator was tested on five to seven oocytes.

