
Figure 2.
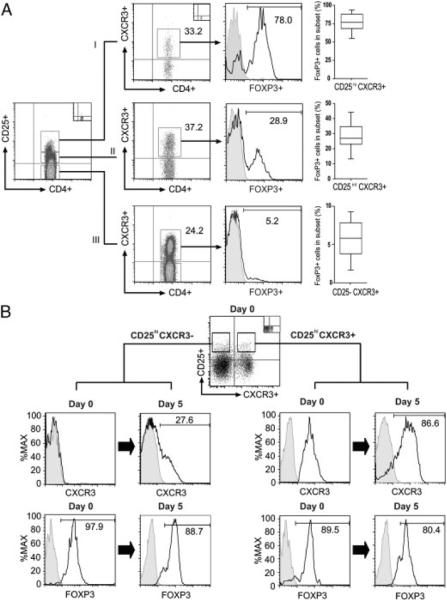
Expression of CXCR3 on CD4+ Tregs. Freshly isolated mononuclear cells were stained with antibodies to CD4, CD25, CXCR3 and FOXP3. (A) After gating on lymphocytes, the expression of CXCR3 was evaluated on CD25hi (I), CD25int/lo (II), and CD25neg (III) CD4+ T cells, and FOXP3 expression (histograms) was evaluated in each subset. The box plots on the right illustrate the median, 25th and 75th percentile and range of FOXP3 expression among the CXCR3-expressing CD4+ T-cell subsets in n = 20 subjects. (B) FACS-sorted populations of CD25hiCXCR3neg or CD25hiCXCR3pos CD4+ T cells (as illustrated) were stimulated with immobilized anti-CD3 and soluble anti-CD28 in the presence of IL-2 (100 IU/mL) for 5 days. The expression of CXCR3 and FOXP3 was evaluated by flow cytometry on day 0 and on day 5 following activation. The histograms on the left illustrate representative expression of CXCR3 and FOXP3 on sorted CXCR3neg cells before and after activation, as indicated. The histograms on the right illustrate expression of CXCR3 and FOXP3 on sorted CXCR3pos cells. Representative of n = 3 experiments.