
Figure 4.
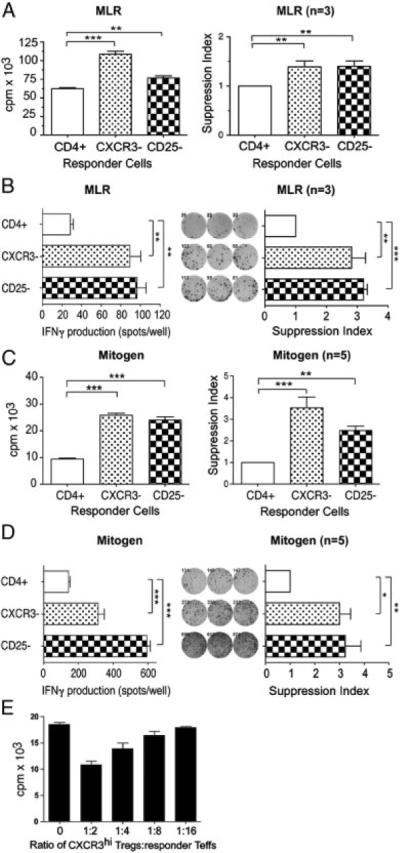
Immunoregulation by CD4+CXCR3+ T cells. CD4+ T cells were positively isolated from PBMCs, and were subsequently depleted of CXCR3-expressing cells (labeled CXCR3−) or CD25-expressing cells (labeled CD25−) using magnetic beads, as described in Materials and methods. Proliferation was assessed by standard 3H thymidine incorporation, and IFN-γ production was assessed by ELISPOT, (A and B) after allogeneic stimulation in a standard mixed lymphocyte reaction (MLR) or (C and D) after mitogen-dependent activation with anti-CD3/anti-CD28. In each panel, a representative experiment is illustrated in the left graph, and the average suppression from multiple experiments (mean1SEM) is illustrated in the graph on the right. (E) Mitogen-induced proliferation of CXCR3-depleted responders, repleted with increasing ratio's of sorted CXCR3hi CD25+ T cells (mean+SEM, representative of n = 3 experiments). Statistical significance was determined by ANOVA and Bonferroni's post test, *p<0.05, **p<0.01 and ***p<0.001.