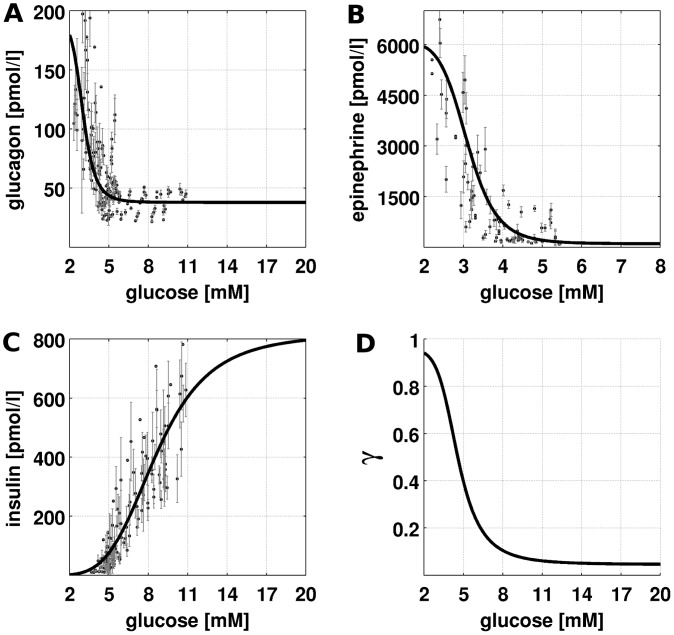
Figure 2. Glucose-Hormone Responses (GHR) of insulin, glucagon and epinephrine and phosphorylation state  .
.
Experimental data from multiple studies based on oral glucose tolerance tests and hypoglycemic, hyperinsulinemic clamp studies and the corresponding fitted GHR curves. Parameters for the GHR curves in Table 1 and experimental data in Dataset S1. (A) Glucagon GHR. Glucagon increases with decreasing blood glucose from a basal concentration of 37.9 pmol/l to a maximal concentration of 190.0 pmol/l with the inflection point at 3.01 mM (B) Epinephrine GHR. Epinephrine increases with decreasing glucose from a basal concentration of 100 pmol/l to a maximal concentration of 6090 pmol/l with the inflection point at 3.1 mM (C) Insulin GHR. Insulin increases with increasing glucose from a basal concentration of 0 pmol/l to a maximal concentration of 818.9 pmol/l with the inflection point at 8.6 mM (D) Resulting phosphorylation state  (Equation 5) based on the GHRs for insulin, glucagon and epinephrine decreasing with increasing glucose from phosphorylated to dephosphorylated.

