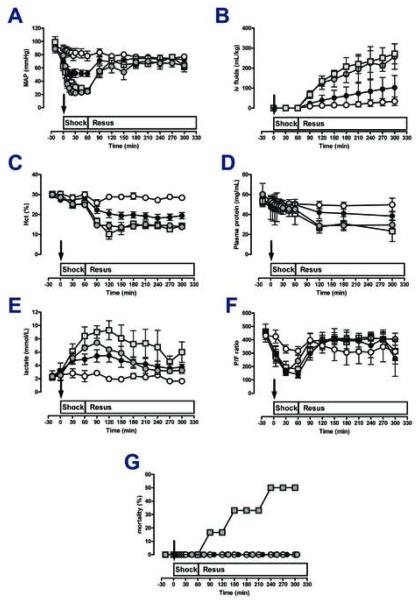
Figure 1. Physiological responses to trauma and hemorrhage.
Arrows indicate the time point of injury/hemorrhage. Resus: Resuscitation period. Data are mean ± SD. Open circles: sham control, n=5. Black circles: Polytrauma only, n=5. Grey circles: Hemorrhage only, n=5. Grey squares: Polytrauma plus hemorrhage, n=3-6. A. Mean arterial pressure (MAP, mmHg). B. I.v. fluids: Intravenous fluid requirements (mL/kg body weight). C. Hematocrit (%). D. Plasma protein concentrations (mg/mL). E. Plasma lactate concentrations (mmol/L). F. P/F ratio: ratio of arterial oxygen concentration to the fraction of inspired oxygen. G. Mortality (%).

