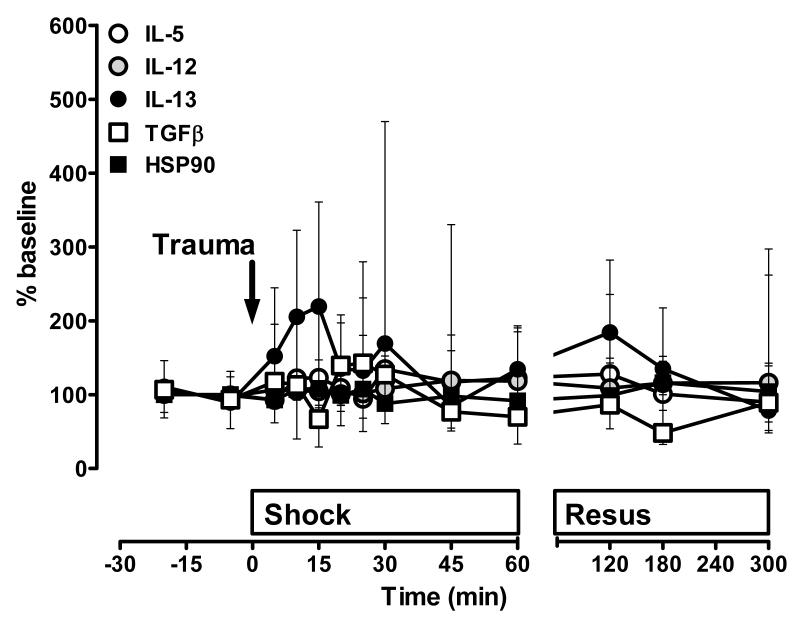
Figure 2. Plasma concentrations of cytokines/heat shock proteins without significant changes after polytrauma alone.
Data are expressed as % of the individual baseline concentrations and plotted as median with interquartile range. n=5 per time point. Open circles: IL-5. Grey circles: IL-12. Black circles: IL-13. Open squares: TGFβ. Black squares: HSP90. The arrow indicates the time point of injury. Resus: Resuscitation period.

