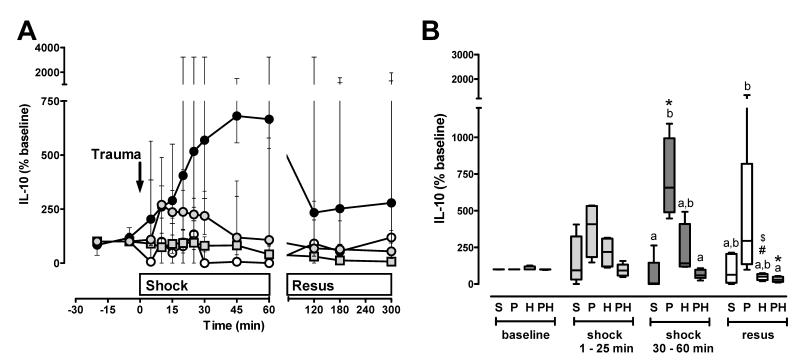
Figure 3. IL-10 plasma concentrations after polytrauma and hemorrhage.
A. Time course. Data are expressed as % of the individual baseline concentrations and plotted as median with interquartile range. Open circles: Sham control, n=5. Black circles: Polytrauma only, n=5. Grey circles: Hemorrhage only, n=5. Grey squares: Polytrauma plus hemorrhage, n=3-6. The arrow indicates the time point of injury/hemorrhage. Resus: Resuscitation period. B. Average IL-10 plasma levels during the individual experimental phases (baseline, early shock phase (t=1-25 min), late shock phase (30-60 min), resuscitation phase (resus)). S: Sham control. Average plasma levels for each animal were calculated as the mean of all plasma levels which were determined during each time period; data from A. P: Polytrauma only. H: Hemorrhage only. PH: Polytrauma plus hemorrhage. Boxes extend from the 25th to 75th percentile; the horizontal line shows the median. Error bars show the 10th and 90th percentile. Groups not sharing the same letter are significantly different (p<0.05) during each individual experimental phase. *: p<0.05 vs. baseline. $: p<0.05 vs. early shock period (1-25 min). #: p<0.05 vs. late shock period (30-60 min).

