
Figure 1. Mapping the NPHP-JBTS-MKS disease protein network using G-LAP-Flp strategy (see also Figures S1 and S2; Tables S1-3; Table S5; Supplemental Bioinformatics Tools).
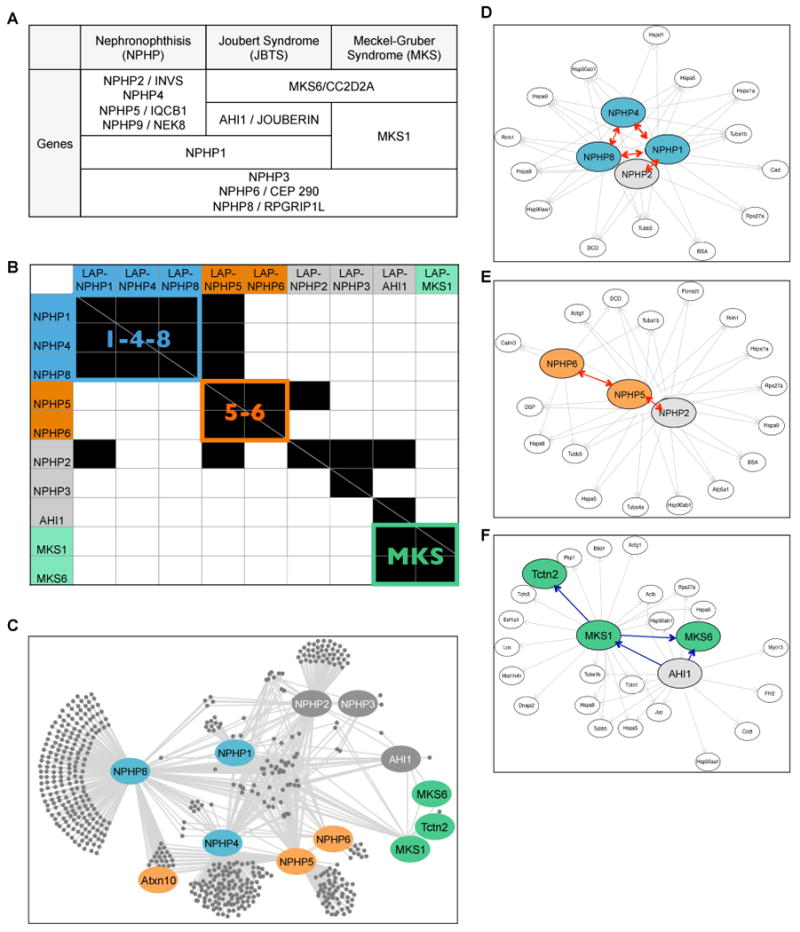
A. List of genes mutated in NPHP-JBTS-MKS ciliopathies.
B. Heat map summarizing MS/MS interactions among NPHP proteins discovered using G-LAP-Flp strategy. Horizontal axis = LAP-tagged “bait” proteins; vertical axis = interacting proteins. Identified interactions are shown in black. The NPHP1-4-8 (“1-4-8”), NPHP5-6 (“5-6”) and MKS modules are color coded in blue, orange and green.
C-F. The NPHP-JBTS-MKS interaction network generated from the R script and visualized using Cytoscape. The entire network is shown in C; individual subgraphs that illustrate the “1-4-8” (IMCD3), “5-6” (IMCD3), and “MKS” (NIH 3T3) modules are shown in D, E, and F. Ellipse = protein; single headed arrows = unreciprocated interactions (pointing to the hits); double headed arrows (red) = reciprocal interactions. Bait proteins and a subset of interactors are highlighted using the color scheme described in Figure 1B.