
Figure 4. Functional requirements for ciliation and 3D spheroid formation show distinct activities for the NPHP “1-4-8”, NPHP “5-6”, and MKS modules (see also Figures S4 and S5; Tables S4, S6 and S7).
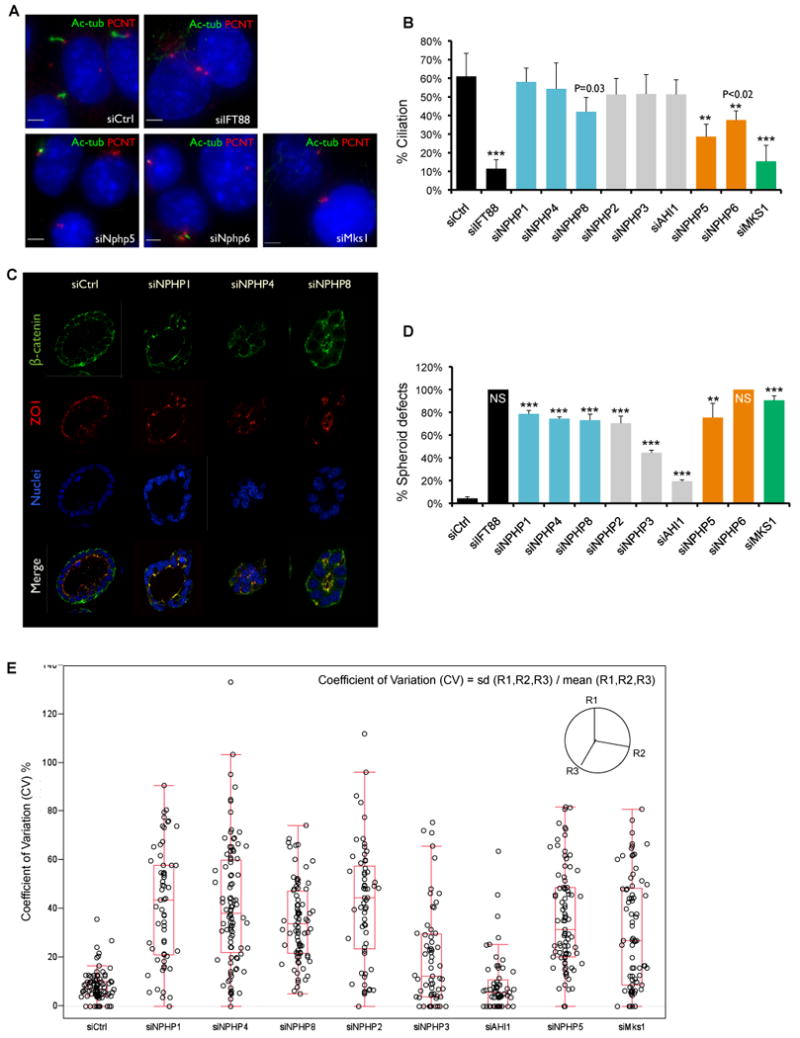
A. Depletion of NPHP5, NPHP6, and MKS1 causes ciliation defects. IMCD3 cells were transfected with siRNAs against individual disease genes, IFT88, or control. Cells were fixed 72 hrs post-transfection and stained for acetylated α-tubulin (green), pericentrin (red), and DNA dye Hoechst 33528 (blue). Scale bar, 5um.
B. Cilia were scored based on positive, adjacent staining of both pericentrin and acetylated α-tubulin. Percentage of nuclei with cilia was plotted (500-700 cells counted). Error bars represent standard error. *** p <0.002; ** p <0.02 (student's t test).
C. Depletion of NPHP1, NPHP4 or NPHP8 cause spheroid defects in 3D kidney culture. IMCD3 cells were transferred to 3D collagen/Matrigel culture 24 hour post-transfection. Spheroids were fixed 72 hours later and immunostained for β-catenin (green) and ZO1 (red). Nuclei were stained with Hoechst 33528 (blue).
D. Percentage of spheroids with defects. 400 – 700 spheroids counted and error bars represent standard error. NS, “No spheroids formed”, shown as 100% defective. *** p <0.001; ** p <0.01 (student's t test).
E. The sphericity of a spheroid was defined using the three radii (R) measurements, which were sampled on each spheroid at 100 degree intervals. The coefficient of variation (CV) was calculated using the formula: CV= standard deviation (R1,R2,R3) / mean (R1,R2,R3). Raw CV data from each knockdown are plotted along with the outlier box plot. Lower quartile = 25th percentile; upper quartile = 75th percentile; top line = upper quartile + 1.5 × interquartile range; bottom line = lower quartile - 1.5 × interquartile range; middle line = 50th percentile; data points outside the lines are outliers.