
Fig. 2.
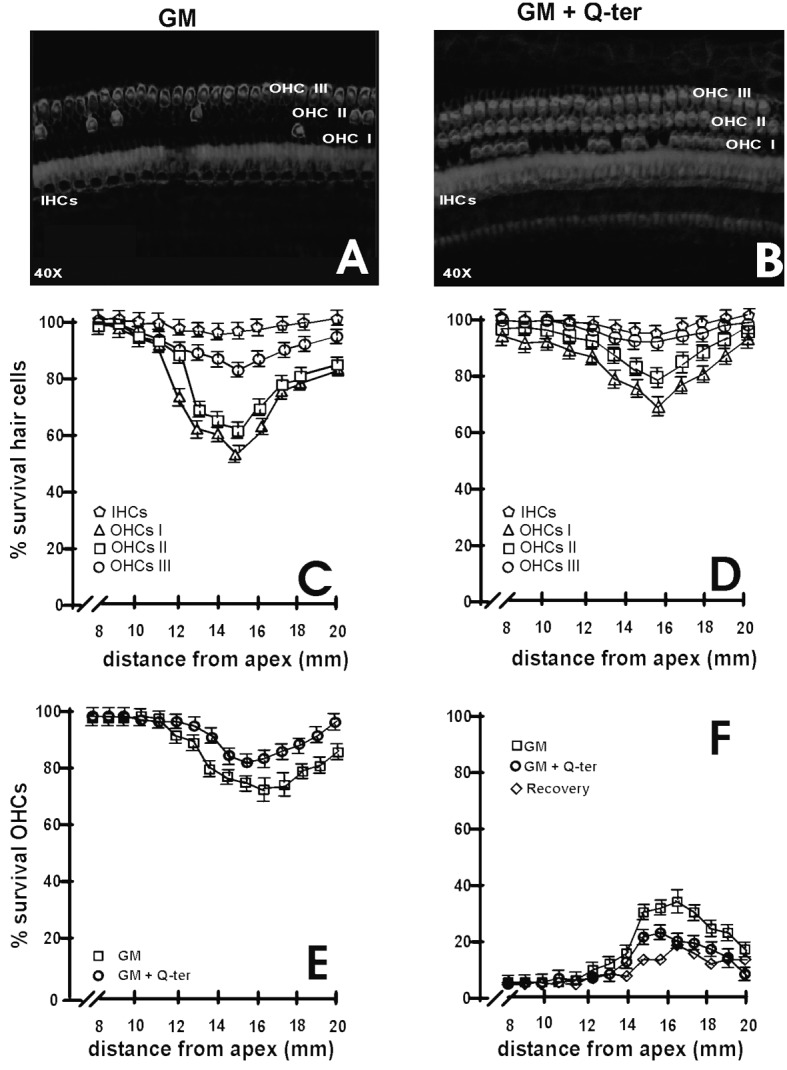
Rhodamine-phalloidin staining and cochleograms. Panels A-B: Confocal images of surface preparations of a damaged area from gentamycin and gentamycin+treatment for rhodamine-phalloidin staining. Panel A shows massive OHC loss and minor IHC disappearance, detected in the medio-basal turn of the cochlea in the group. Panel B shows moderate hair cell loss for OHCs and IHCs in gentamycin plus Q-ter treated animals. Panels C-F: cochleograms were plotted as percentage with standard deviation of survival IHCs and OHCs for each row against distance from the apex. A gradient of OHC loss was observed for gentamycin treatment (panel C) and gentamycin+Q-ter treatment (panel D). Quantitative analysis showed that gentamycin treatment caused a more consistent OHC loss in a narrow region of the cochlea from 11-19 mm from the apex. Q-ter treated animals had significantly less OHC loss than gentamycintreated animals in a narrower area of about 13-19 mm from the apex. Panel E: average survival of cells in the GM (square) and GM+Q-ter (circles) groups. Panel F shows average cell loss and recovery of damage by concomitant Q-ter treatment in group GM (squares) and group GM+Q-ter (circles) and recovery (diamonds).