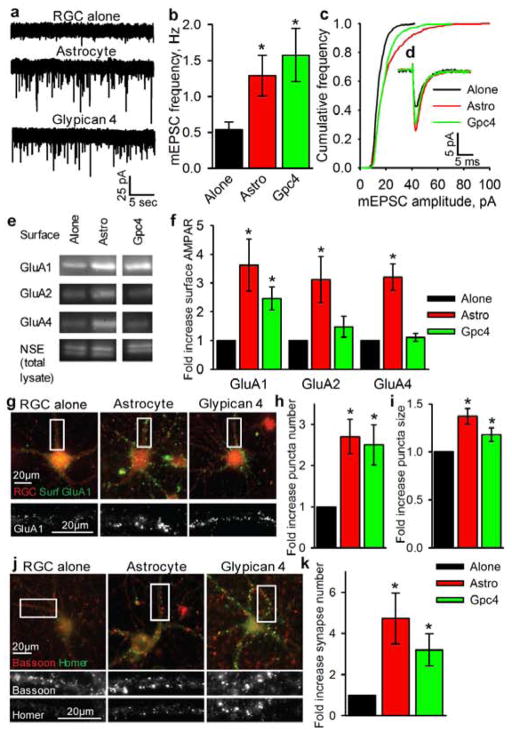
Figure 2. Gpc4 is sufficient to strengthen glutamatergic synapses & increase surface GluA1-containing AMPARs.
a,b,c,d Example mEPSC recordings (a) show frequency (b) & amplitude (c) are sig increased in RGCs cultured with Gpc4, average traces aligned by rise-time (d). Average mEPSC amplitude (RGC alone = 13.8±0.7pA, astrocyte = 20.0±1.2pA p<0.05, Gpc4 = 17.8±1.4pA p<0.05). N = 16 cells RGC alone, 16 astrocyte, 13 Gpc4.
e,f, Gpc4 increases surface GluA1 AMPARs in RGCs. Western blots (e) of surface AMPAR subunits GluA1-4 & NSE (neuron specific enolase loading control from total lysate), quantification (f), full blot Fig S9. N = 6 expts GluA1,2; 3 expts GluA4.
g,h,i, Gpc4 clusters GluA1-containing AMPARs on the RGC surface. Example images (g) of surface GluA1 (green) and RGC processes (red), bottom panel zoom showing GluA1 (white). Quantification of number (h) and size (i) of GluA1 clusters. N = 7 expts.
j,k, Gpc4 induces structural synapses. Example images (j) of pre- (bassoon, red) & postsynaptic (homer, green) staining, bottom panels zoom each marker (white). Quantification of synapse number (k) (colocalisation of pre & postsynaptic puncta). N = 6 expts.
* p<0.05, error bars ±S.E.M.

